04 May 2017
Yesterday the government of Puerto Rico asked for bankruptcy relief in federal court. Puerto Rico owes about $70 billion to bondholders and about $50 billion in pension obligations. Before asking for protection the government offered to pay back some of the debt (50% according to some news reports) but bondholders refused. Bondholders will now fight in court to recover as much of what is owed as possible while the government and a federal oversight board will try to lower this amount. What can we expect to happen?
A case like this is unprecedented, but there are plenty of data on restructurings. An op-ed by Juan Lara pointed me to this blog post describing data on 180 debt restructurings. I am not sure how informative these data are with regards to Puerto Rico, but the plot below sheds some light into the variability of previous restructurings. Colors represent regions of the world and the lines join points from the same country. I added data from US cases shown in this paper.
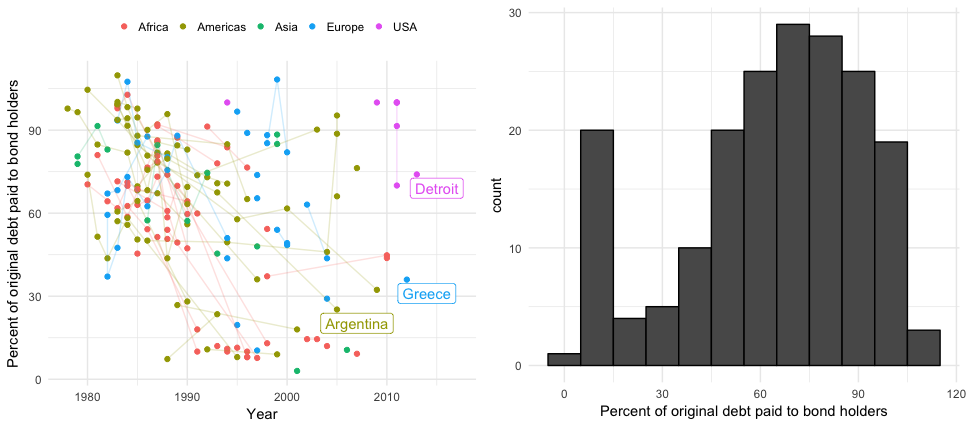
The cluster of points you see below the 30% mark appear to be cases involving particularly poor countries: Albania, Argentina, Bolivia, Ethiopia, Bosnia and Herzegovina, Guinea, Guyana, Honduras, Cameroon, Iraq, Congo, Rep., Costa Rica, Mauritania, Sao Tome and Principe, Mozambique, Senegal, Nicaragua, Niger, Serbia and Montenegro, Sierra Leone, Tanzania, Togo, Uganda, Yemen, and Republic of Zambia. Note also these restructurings happened after 1990.
24 Apr 2017
This is a short open letter to those that believe scientists have a “liberal bias” and question their objectivity. I suspect that for many conservatives, this Saturday’s March for Science served as confirmation of this fact. In this post I will try to convince you that this is not the case specifically by pointing out how scientists often annoy the left as much as the right.
First, let me emphasize that scientists are highly appreciative of members of Congress and past administrations that have supported Science funding though the DoD, NIH and NSF. Although the current administration did propose a 20% cut to NIH, we are aware that, generally speaking, support for scientific research has traditionally been bipartisan.
It is true that the typical data-driven scientists will disagree, sometimes strongly, with many stances that are considered conservative. For example, most scientists will argue that:
- Climate change is real and is driven largely by increased carbon dioxide and other human-made emissions into the atmosphere.
- Evolution needs to be part of children’s education and creationism has no place in Science class.
- Homosexuality is not a choice.
- Science must be publically funded because the free market is not enough to make science thrive.
But scientists will also hold positions that are often criticized heavily by some of those who identify as politically left wing:
- Current vaccination programs are safe and need to be enforced: without heard immunity thousands of children would die.
- Genetically modified organisms (GMOs) are safe and are indispensable to fight world hunger. There is no need for warning labels.
- Using nuclear energy to power our electrical grid is much less harmful than using natural gas, oil and coal and, currently, more viable than renewable energy.
- Alternative medicine, such as homeopathy, naturopathy, faith healing, reiki, and acupuncture, is pseudo-scientific quackery.
The timing of the announcement of the March for Science, along with the organizers’ focus on environmental issues and diversity, may have made it seem like a partisan or left-leaning event, but please also note that many scientists criticized the organizers for this very reason and there was much debate in general. Most scientists I know that went to the march did so not necessarily because they are against Republican administrations, but because they are legitimately concerned about some of the choices of this particular administration and the future of our country if we stop funding and trusting science.
If you haven’t already seen this Neil Degrasse Tyson video on the importance of Science to everyone, I highly recommend it.
06 Apr 2017
This page was generated in error. The “Science really is non-partisan: facts and skepticism annoy everybody” blog post is here
Apologies for the inconvenience.
06 Apr 2017
La Universidad de Puerto Rico (UPR) recibe aproximádamente 800 millones de
dólares del estado cada año. Esta inversión le permite ofrecer salarios más
altos, lo cual atrae a los mejores profesores, tener las mejores instalaciones
para la investigación y enseñanza, y mantener el precio por crédito más bajo que las universidades privadas. Gracias a estas grandes
ventajas, la UPR suele ser la primera opción del estudiantado puertorriqueño, en
particular los dos recintos más grandes, Río Piedras (UPRRP) y Mayagüez. Un
estudiante que aprovecha su tiempo en la UPR, además de formarse como ciudadano, puede
entrar exitosamente en la fuerza laboral o continuar sus estudios en las mejores escuelas graduadas. El
precio módico del crédito, en combinación con las becas federales Pell, han
ayudado a miles de estudiantes económicamente desaventajados a completar sus
estudios sin tener que endeudarse.
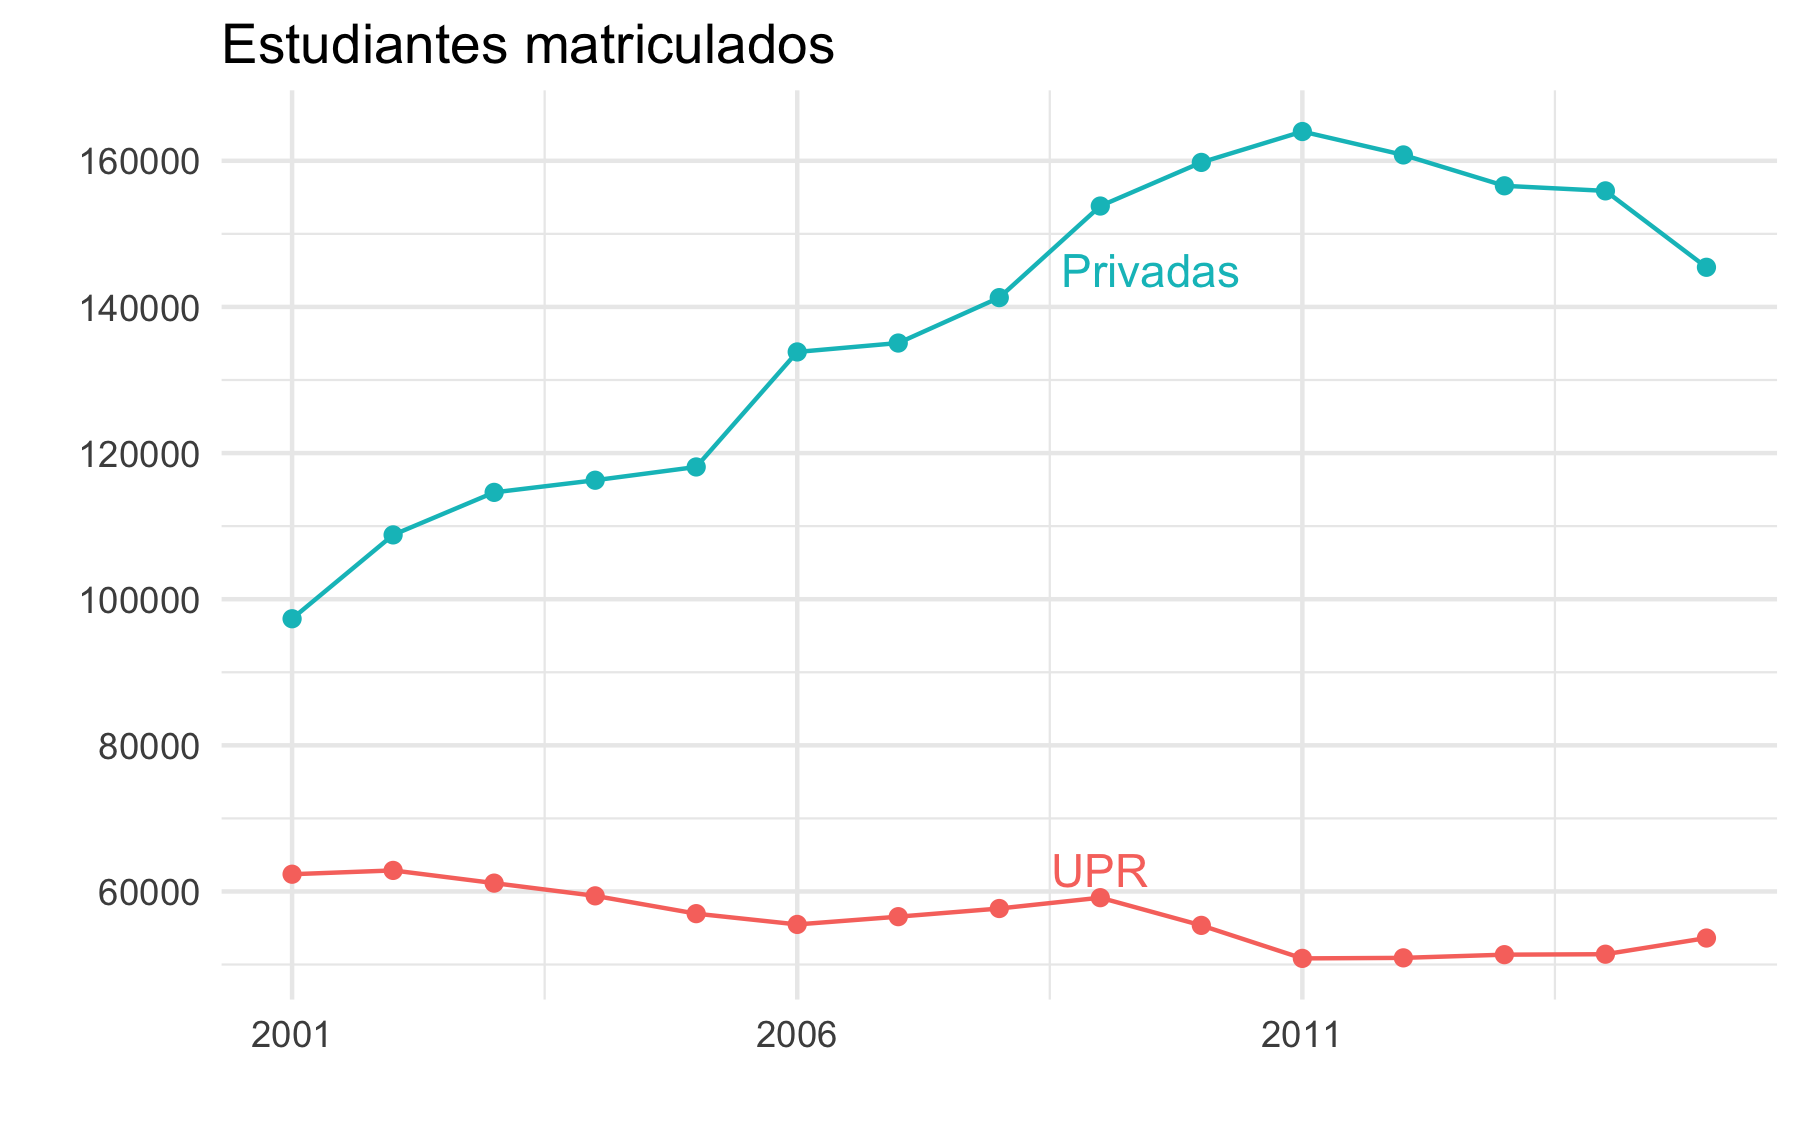
En la pasada década una realidad preocupante ha surgido: mientras la demanda por la
educación universitaria ha crecido, demostrado por el crecimiento de la matrícula en las universidades privadas, el número de estudiantes matriculados en la UPR
ha bajado.
¿Por qué ha bajado la matrícula en la UPR?
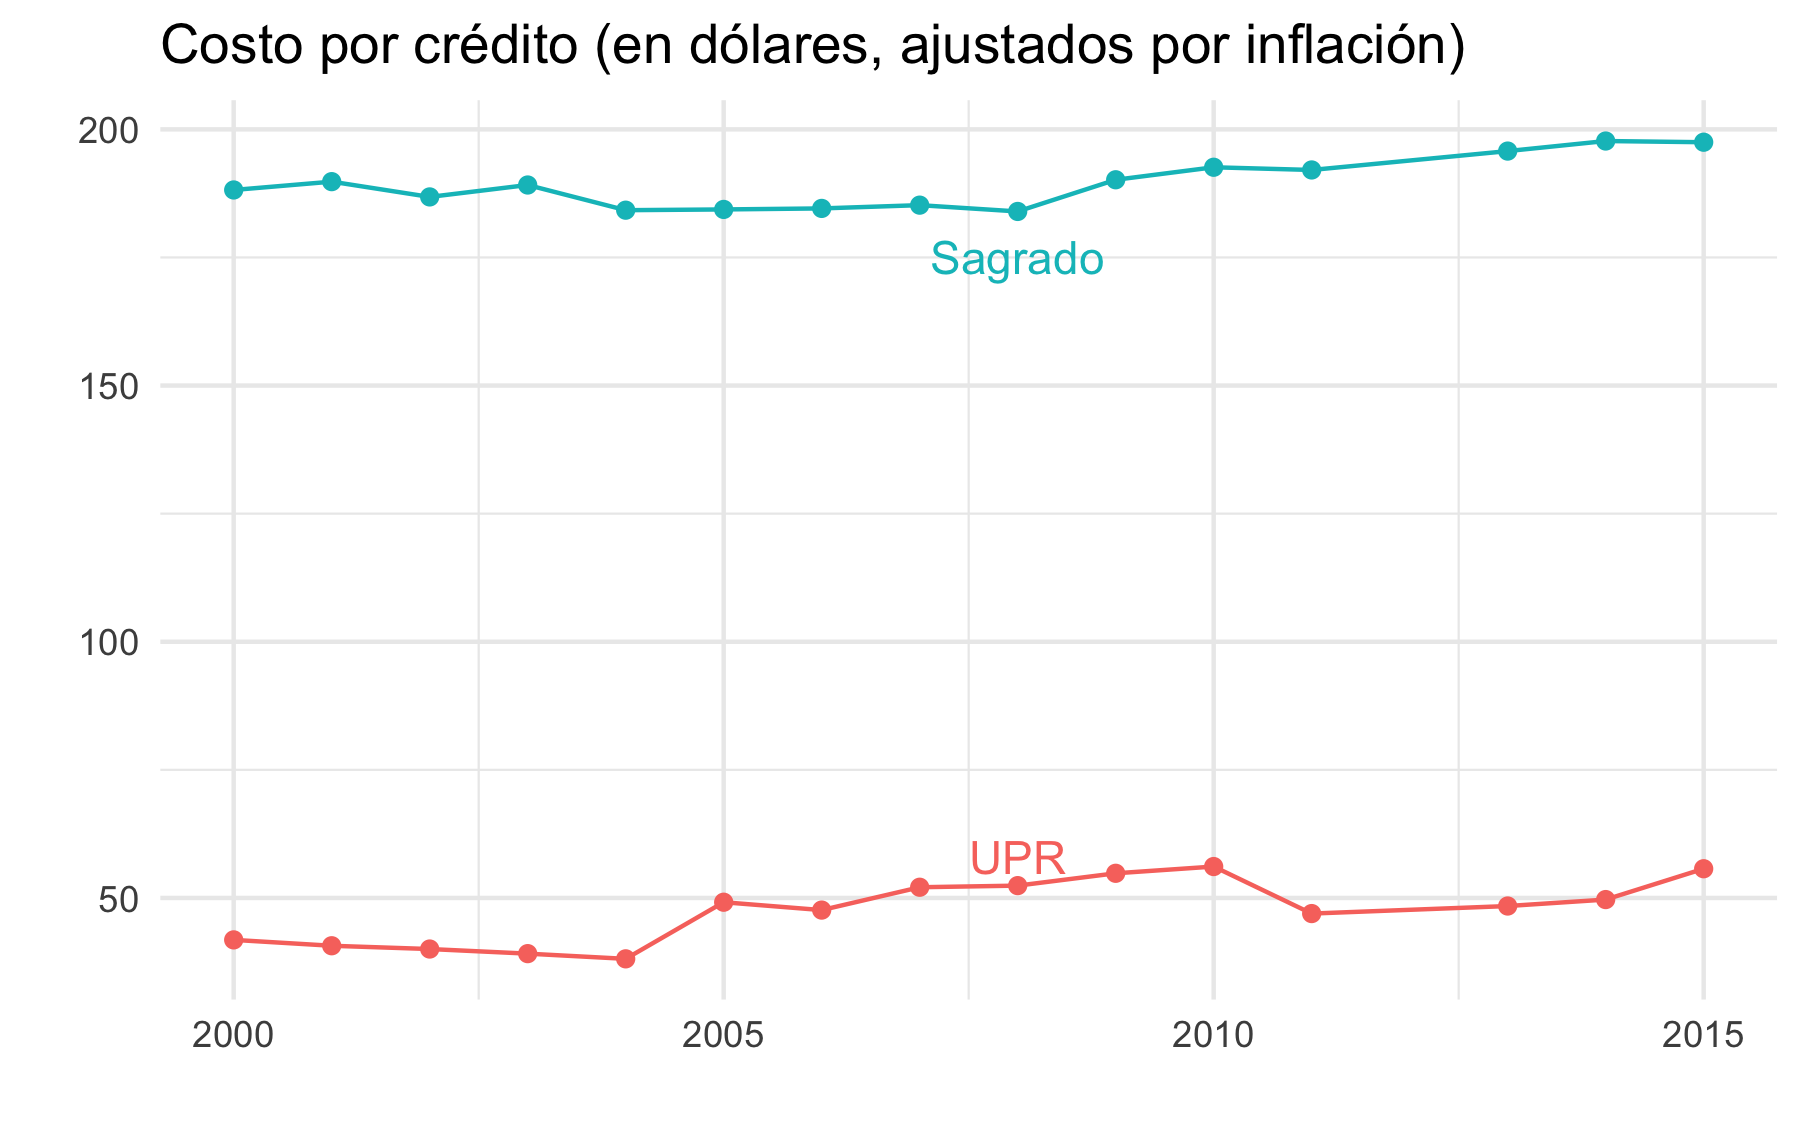
Una explicación popular
es que “la baja en matrícula es provocada por el aumento en el costo de la
matrícula”. La teoría de que un alza en costos disminuye la matrícula es
comúnmente aceptada pues tiene sentido económico: cuando el precio sube, las
ventas bajan. Pero entonces ¿por qué ha crecido la matrícula en las
universidades privadas? Tampoco lo explica un crecimiento en el número de estudiantes ricos ya
que, en el 2012, la mediana de ingreso familiar de aquellos jóvenes matriculados en
algún recinto de la UPR era de $32,379; en contraste, la mediana de ingreso de
aquellos que están matriculados en una universidad privada era de $25,979. Otro problema con esta teoría es que, una vez ajustamos por inflación, el costo del crédito se ha mantenido más o menos estable tanto en la UPR como en las unversidades privadas.
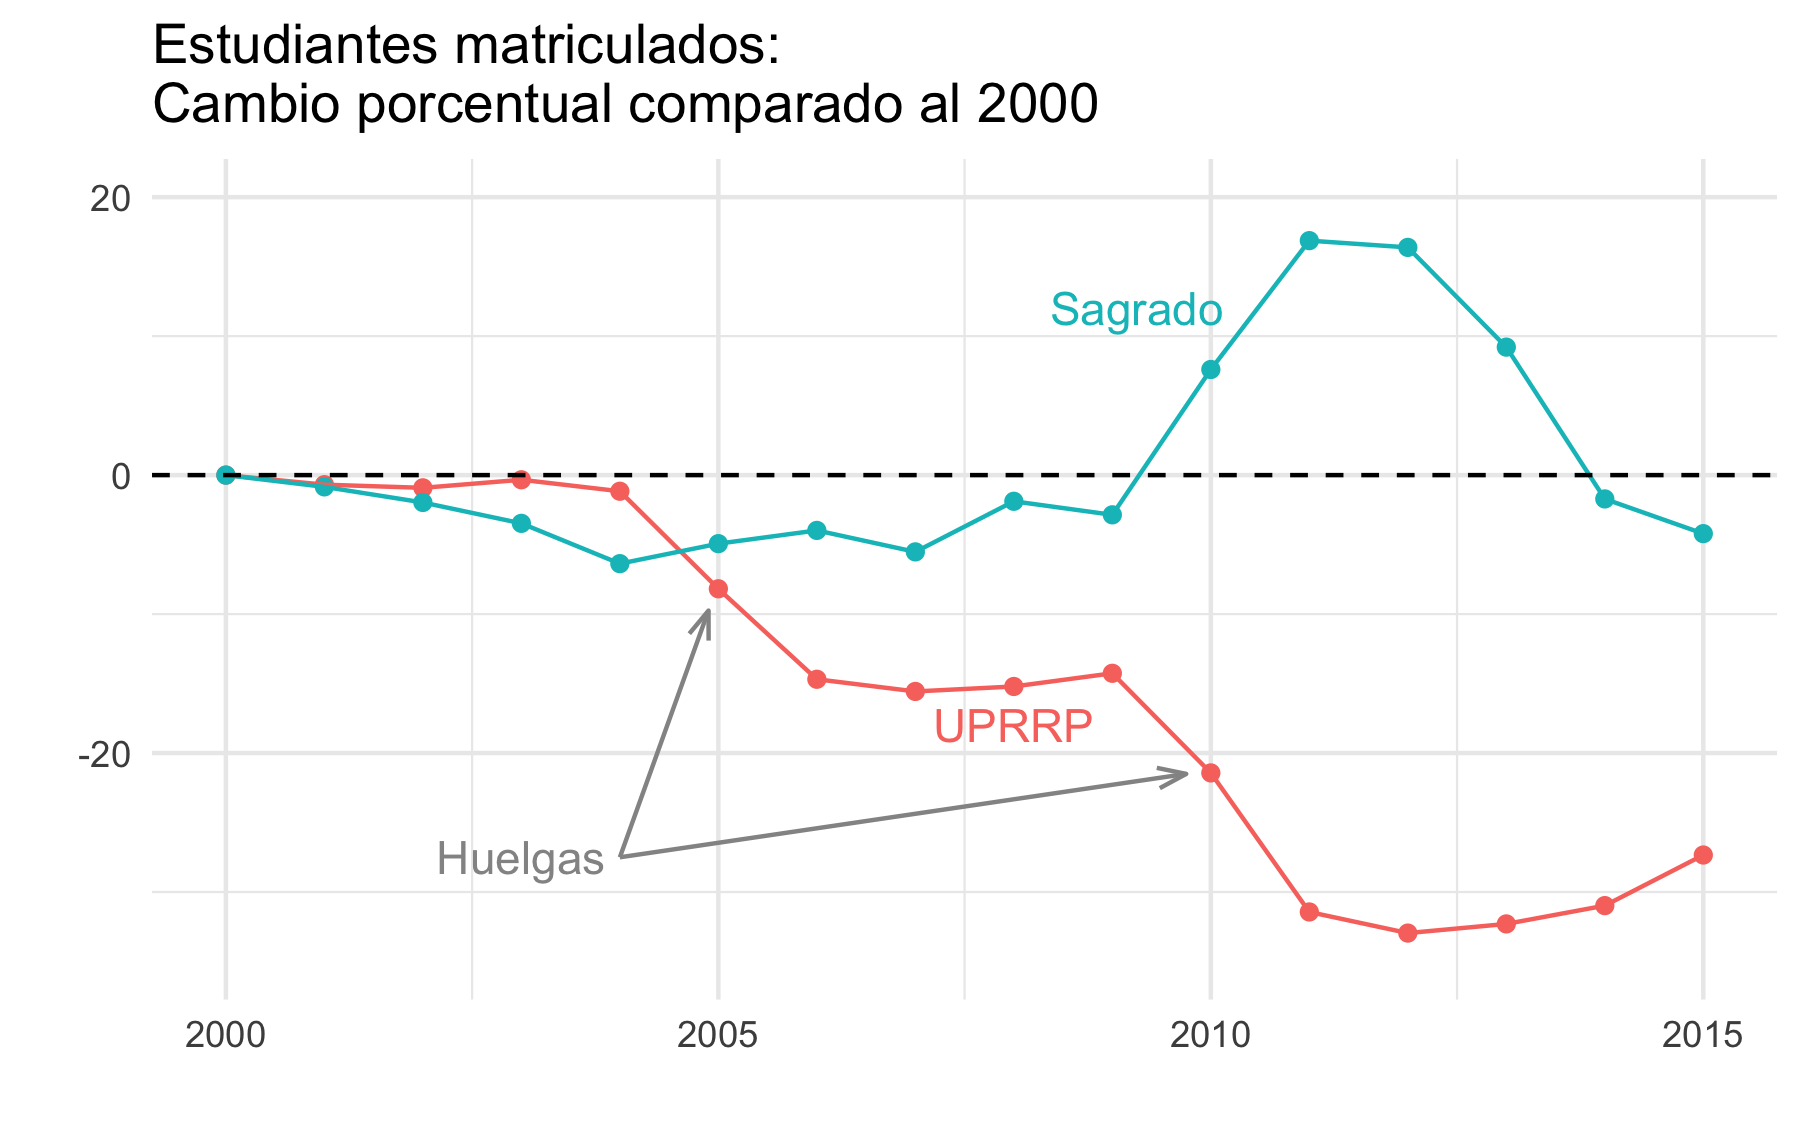
Ahora, si miramos detenidamente los datos de la matrícula notamos que los bajones más grandes fueron precisamente en los años de huelga (2005, 2010, 2011). En el 2005 comienza una tendencia positiva en la matrícula del Sagrado, con el crecimiento más alto en el 2010 y el 2011.
Actualmente, varios recintos, incluyendo Río Piedras, están cerrados
indefinidamente. En una asamblea nacional asistida por 10% de los más de 50,000 estudiantes del sistema, una huelga indefinida fue aprobada en una votación de 4,522 a 1,154. Para reiniciar labores los estudiantes exigen que “no se impongan sanciones a los estudiantes que participen en la huelga, que se presente un plan de reforma universitaria elaborado por la comunidad universitaria, que se audite la deuda pública y se restituya a los miembros de la comisión evaluadora de la auditoría pública y su prepuesto”. Esto ocurre como respuesta a la propuesta por la Junta de Supervición Fiscal (JSF) y el gobernador de
reducir el presupuesto de la UPR como parte de sus intentos de
resolver una grave crisis
fiscal.
Durante el cierre, los estudiantes en huelga le impiden la entrada al recinto al
resto de la comunidad universitaria, incluyendo aquellos que no consideran la huelga una manera efectiva de protesta. Aquellos que se oponen y quieren continuar estudiando, se les acusa de ser egoistas o de ser aliados de quienes quieren destruir la UPR. Hasta ahora estos estudiantes tampoco han recibido el apoyo explícito de los profesores y administradores. No debe sorprendernos si los que quieren continuar estudiando recurren a pagar más en una universidad privada.

Aunque existe la posibilidad de que la huelga ejerza suficiente presión política para que se responda a las exigencias determinadas en la asamblea, hay otras posibilidades menos favorables para los estudiantes:
- La falta de actividad académica resulta en el exilio de miles de estudiantes a las universidades privadas.
- La JSF usa el cierre para justificar aun más recortes: una institución no requiere millones de dolares al día si está cerrada.
- Los recintos cerrados pierden su acreditación ya que una universidad en la cual no se da clases no puede cumplir con las normas necesarias.
- Se revocan las becas Pell a los estudiantes en receso.
Hay mucha evidencia empírica que demuestra la importancia de la educación universitaria accesible. Lo mismo no es cierto sobre las huelgas como estrategia para defender dicha educación. Y cabe la posibildad que la huelga indefinida tenga el efecto opuesto y perjudique enormemente a los estudiantes, en particular a los que se ven forzados a matricularse en una universidad privada.
Notas:
-
Data proporcionada por el Consejo de Educación de Puerto Rico (CEPR).
-
El costo del crédito del 2011 no incluye la cuota.
03 Apr 2017
Data analysis workflows and recipes are commonly used in science. They
are actually indispensable since reinventing the wheel for each
project would result in a colossal waste of time. On the other hand,
mindlessly applying a workflow can result in
totally wrong conclusions if the required assumptions don’t hold.
This is why successful data analysts rely heavily on interactive
data analysis (IDA). I write today because I am somewhat
concerned that the importance of IDA is not fully appreciated by many
of the policy makers and thought leaders that will influence how we
access and work with data in the future.
I start by constructing a very simple example to illustrate the
importance of IDA. Suppose that as
part of a demographic study you are asked to summarize male heights
across several counties. Since sample sizes are large and heights are
known to be well approximated by a normal distribution you feel
comfortable using a true and tested recipe:
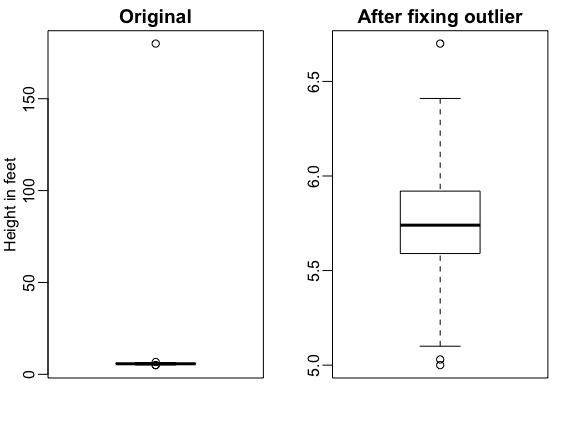
report the average and standard deviation as a summary. You are
surprised to find a county with average heights of 6.1 feet with a
standard deviation (SD) of 7.8 feet. Do you start writing a paper and a
press release to describe this very interesting finding? Here,
interactive data analysis saves us from naively reporting this.
First, we note that the standard deviation is impossibly big if data is in
fact normally distributed: more than 15% of heights would be
negative. Given this nonsensical result, the next
obvious step for an experienced data analyst is to explore the data,
say with a boxplot (see below). This immediately reveals a problem, it
appears one value was reported in centimeters: 180 centimeters not
feet. After fixing this, the summary changes to an average height
of 5.75 and with a 3 inch SD.
Years of data analysis experience will show you that examples like this are
common. Unfortunately, as data and analyses get more complex, workflow
failures are harder to detect and often go unnoticed. An important
principle many of us teach our trainees is to carefully check for
hidden problems when data analysis leads you to unexpected results,
especialy when the unexpected results holding up benefits us
professionally, for example by leading to a publication.
Interactive data analysis is also indispensable for the
development of new methodology. For example, in my field of research, exploring
the data has led to the discovery of the need for new methods and
motivated new approaches that handle specific cases that existing
workflows can’t handle.
So why I am concerned?
As public datasets become larger and more
numerous, many funding agencies, policy makers and industry leaders are
advocating for using cloud computing to bring computing to the
data. If done correctly, this would provide a great improvement over
the current redundant and unsystematic approach of everybody downloading data and working with it locally. However, after
looking into the details of some of these plans, I have become a bit
concerned that perhaps the importance of IDA is not fully appreciated by decision makers.
As an example consider the NIH efforts to promote data-driven discovery
that center around plans for the
Data Commons. The linked page
describes an ecosystem with four components one of which is
“Software”. According to the description, the software component of
The Commons should provide “[a]ccess to and deployment of scientific analysis
tools and pipeline workflows”. There is no mention of a strategy that
will grant access to the
raw data. Without this, carefully checking the workflow output and
developing the analysis tools and pipeline workflows of the future
will be difficult.
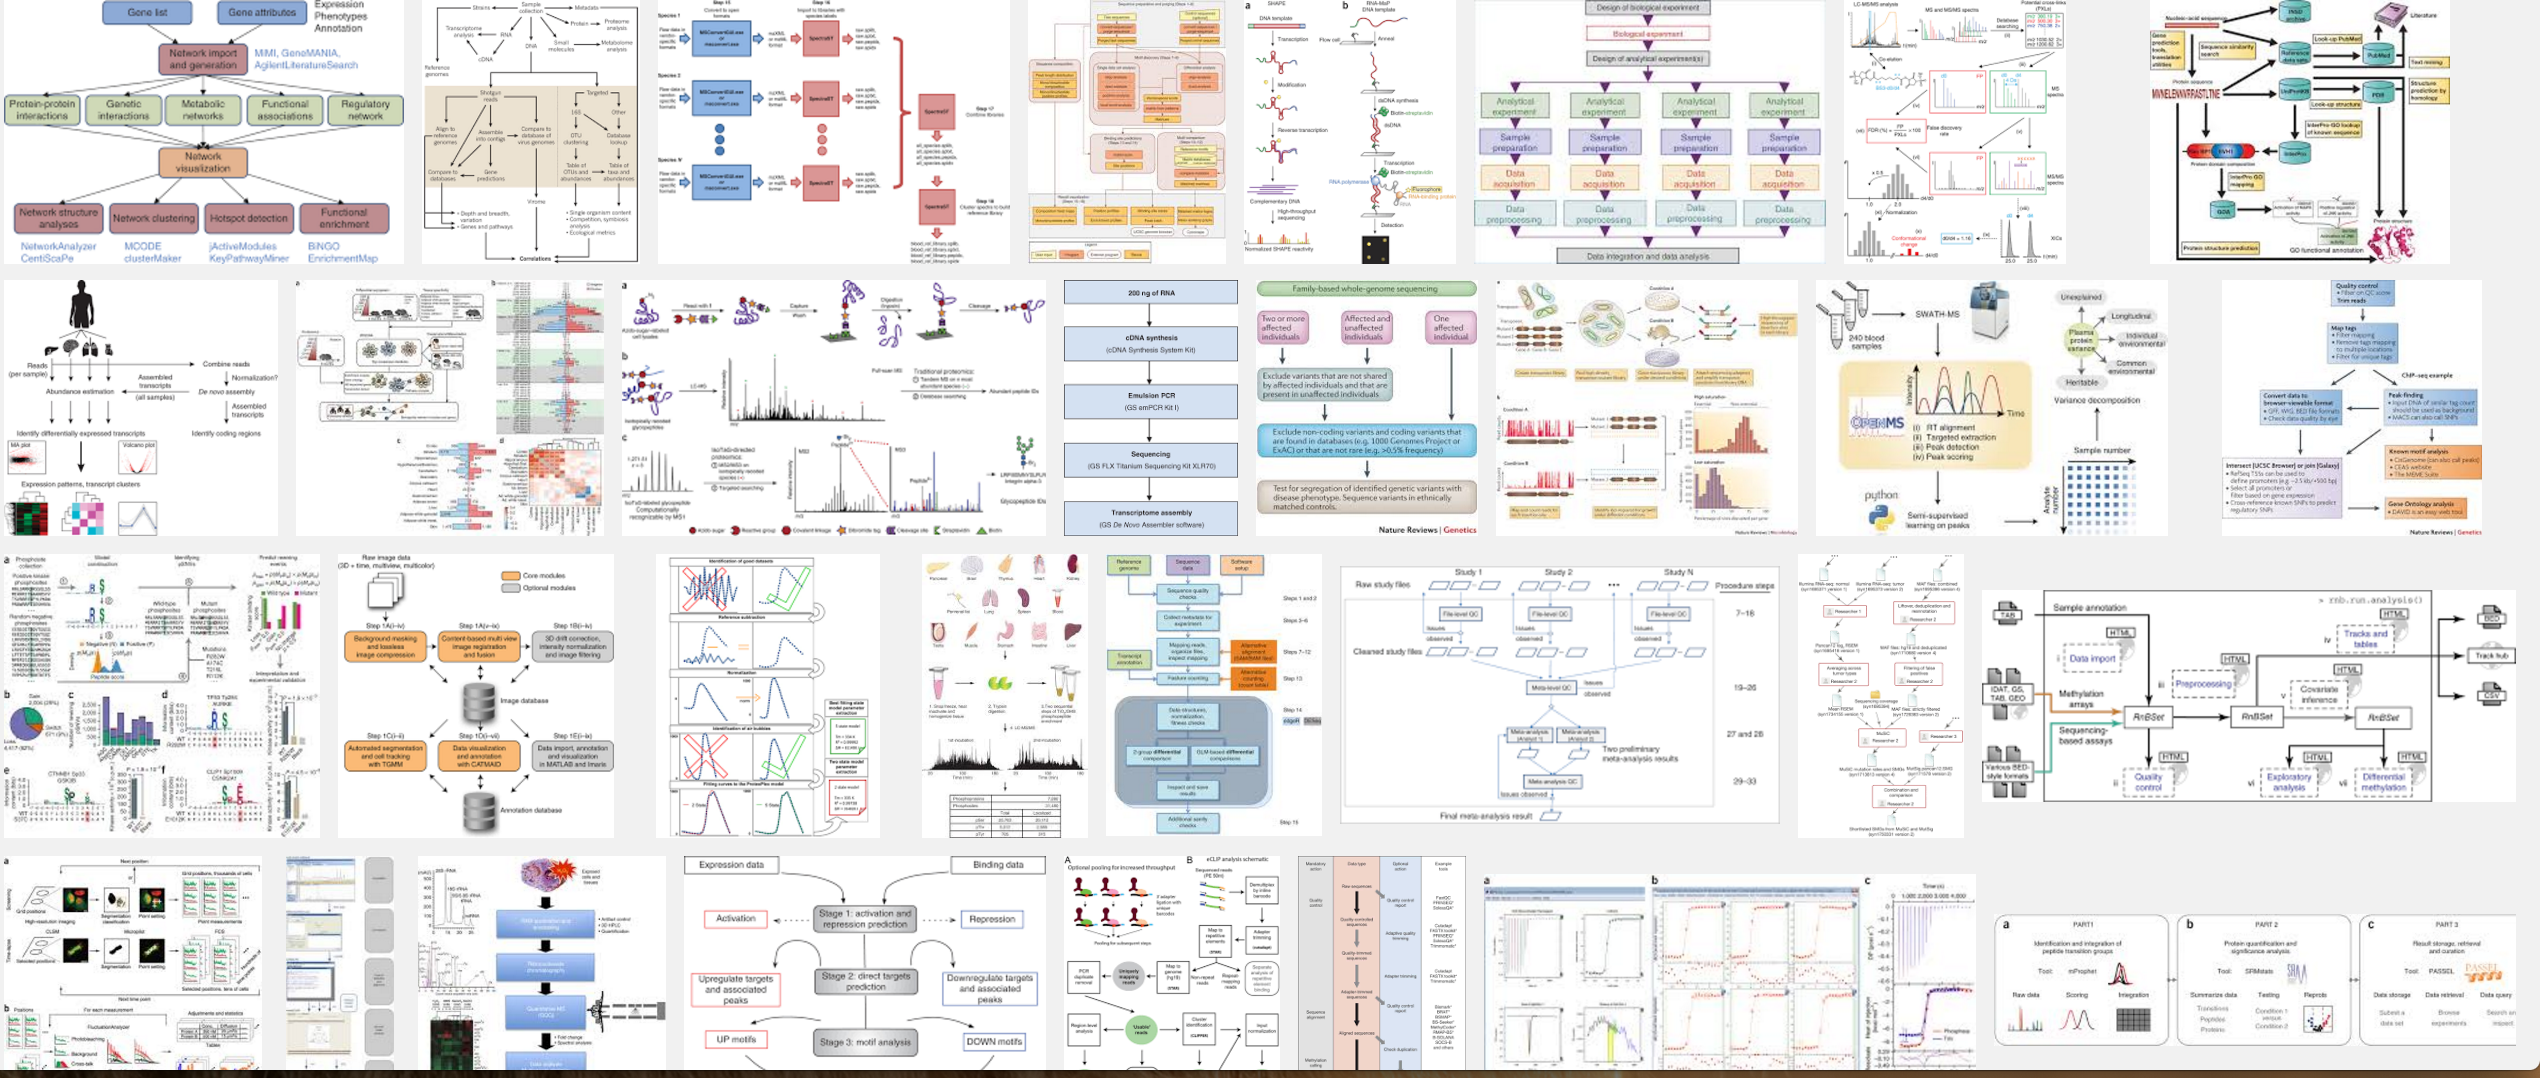
I note that data analysis workflows are very popular in fields in which data
analysis is indispensible, as is the case in biomedical research, my
focus area. In this field, data generators, which typically
lead the scientific enterprise, are not always trained data
analysts. But the literature is overflowing with proposed workflows.
You can gauge the popularity of these by the vast number
published in the nature journals as demonstrated by this
google search:
In a field in which data generators are not data analysis experts, the
workflow has the added allure that it removes the need to think deeply about
data analysis and instead shifts the responsibility to pre-approved
software. Note that these workflows are not always described with the
mathematical language or computer coded needed to truly understand it
but rather with a series of PowerPoint shapes. The gist of the typical
data analysis workflow can be simplified into the following:
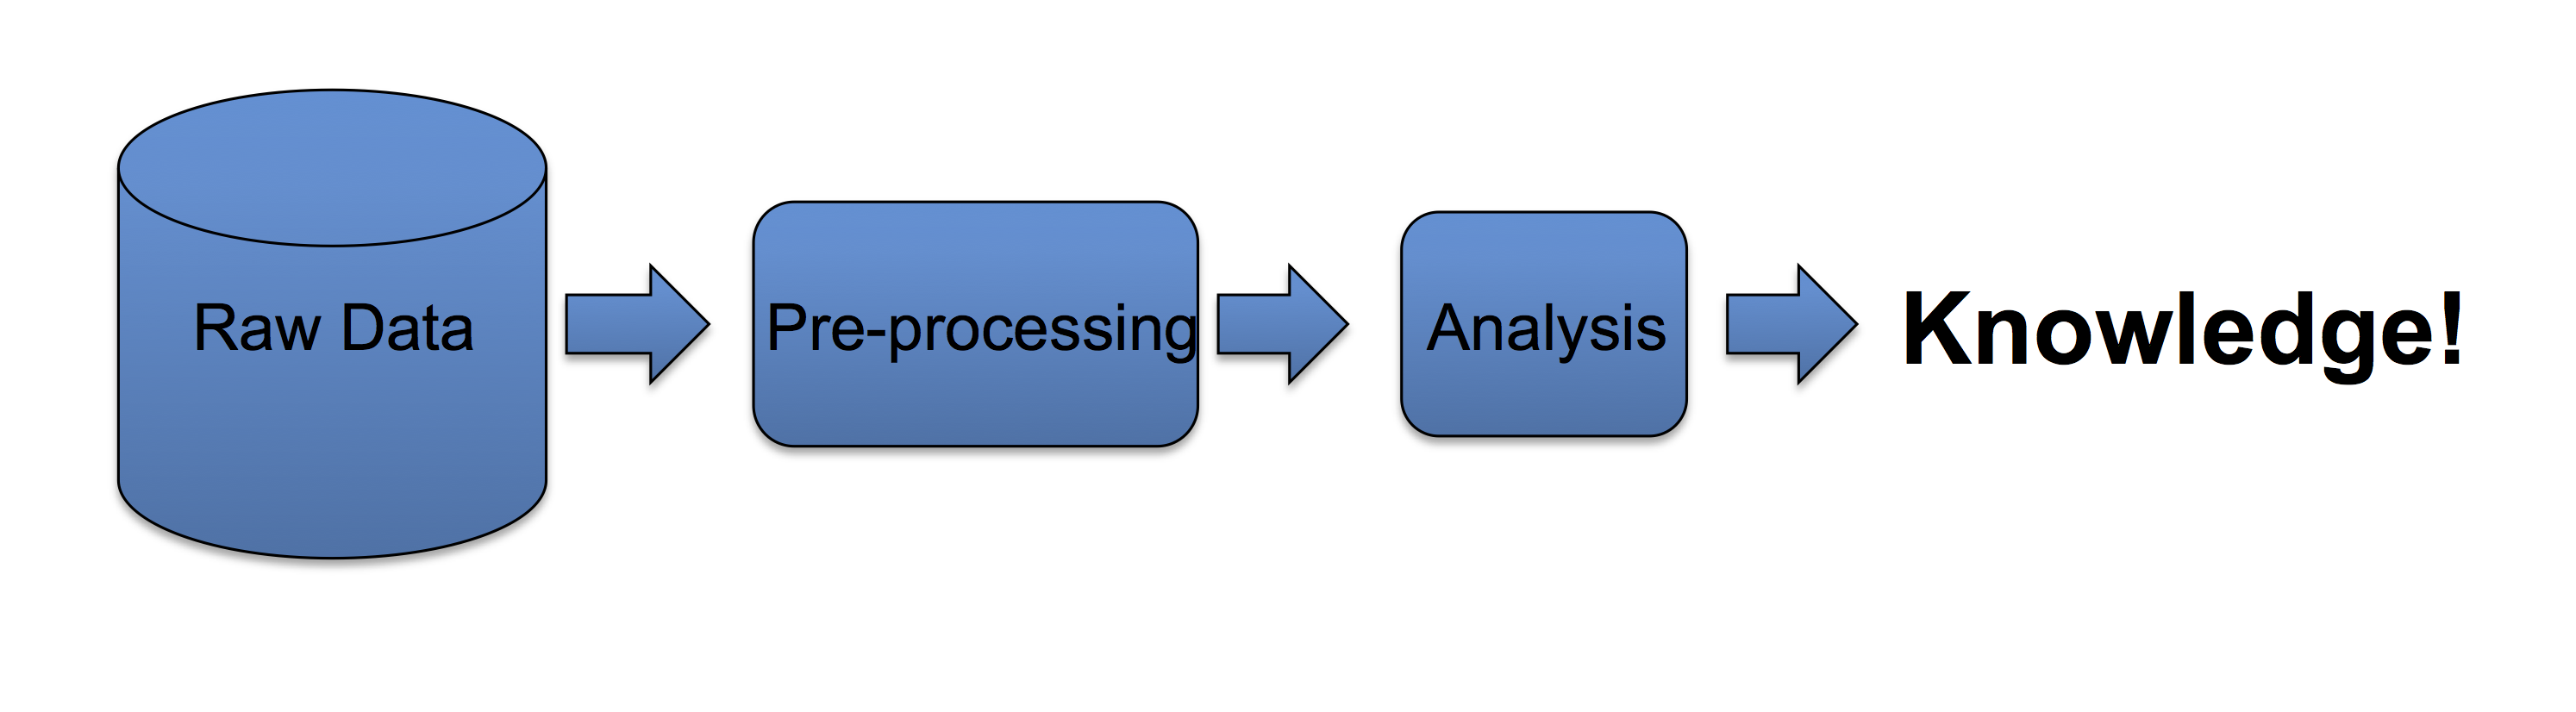
This simplification of the data analysis process makes it particularly
worrisome that the intricacies of IDA are not fully appreciated.
As mentioned above, data analysis workflows are a necessary component of
the scientific enterprise. Without them the process would slow down to
a halt. However, workflows should only be implemented once consensus
is reached regarding its optimality. And even then, IDA is needed to
assure that the process is performing as expected. The career of many of my
colleagues has been dedicated mostly to the development of such
analysis tools. We have learned that rushing to implement workflows
before they are mature enough can have widespread negative
consequences. And, at least in my experience, developing rigorous tools is
impossible without interactive data analysis. So I hope that this post
helps make a case for the importance of interactive data analysis and
that it continues to be a part of the scientific enterprise.
 Follow us on twitter