20 Feb 2017
I’ve gotten a number of inquiries over the last 2 years about my podcasting setup and I’ve been meaning to write about it but….
But here it is! I actually wanted to write this because I felt like there actually wasn’t a ton of good information about this on the Internet that wasn’t for people who wanted to do it professionally but were rather more “casual” podcasters. So here’s what I’ve got.
There are two types of podcasts roughly: The kind you record with everyone in the same room and the kind you record where everyone is in different rooms. They both require slightly different setups so I’ll talk about both. For me, Elizabeth Matsui and I record The Effort Report locally because we’re both at Johns Hopkins. But Hilary Parker and I record Not So Standard Deviations remotely because she’s on the other side of the country most of the time.
Recording Equipment
When Hilary and I first started we just used the microphone attached to the headphones you get with your iPhone or whatever. That’s okay but the sound feels very “narrow” to me. That said, it’s a good way to get started and it likely costs you nothing.
The next level up for many people is the Blue Yeti USB Microphone which is perfectly fine microphone and not too expensive. Also, it uses USB (as opposed to more professional XLR) so it connects to any computer, which is nice. However, it typically retails for $120, which isn’t nothing, and there are probably cheaper microphones that are just as good. For example, Jason Snell recommends the Audio Technica ATR2100 which is only about $70.
If you’re willing to shell out a little more money, I’d highly recommend the Zoom H4n portable recorder. This is actually two things: a microphone and a recorder. It has a nice stero microphone built into the top along with two XLR inputs on the bottom that allow you to record from external mics. It records to SD cards so it’s great for a portable setup where you don’t want to carry a computer around with you. It retails for about $200 so it’s not cheap, but in my opinion it is worth every penny. I’ve been using my H4n for years now.
Because we do a lot or recording for our online courses here, we’ve actually got a bit more equipment in the office. So for in-person podcasts I sometimes record using a Sennheiser MKH416-P48US attached to an Auray MS-5230T microphone stand which is decidedly not cheap but is a great piece of hardware.
By the way, a microphone stand is great to have, if you can get one, so you don’t have to set the microphone on your desk or table. That way if you bump the table by accident or generally like to bang the table, it won’t get picked up on the microphone. It’s not something to get right away, but maybe later when you make the big time.
Recording Software
If you’re recording by yourself, you can just hook up your microphone to your computer and record to any old software that records sound (on the Mac you can use Quicktime). If you have multiple people, you can either
- Speak into the same mic and have both your voices recorded on the same audio file
- Use separate mics (and separate computers) and record separtely on to separate audio files. This requires synching the audio files in an editor, but that’s not too big a deal if you only have 2-3 people.
For local podcasts, I actually just use the H4n and record directly to the SD card. This creates separate WAV files for each microphone that are already synced so you can just plop them in the editor.
For remote podcasts, you’ll need some communication software. Hilary and I use Zencastr which has its own VoIP system that allows you to talk to anyone by just sending your guests a link. So I create a session in Zencastr, send Hilary the link for the session, she logs in (without needing any credentials) and we just start talking. The web site records the audio directly off of your microphone and then uploads the audio files (one for each guest) to Dropbox. The service is really nice and there are now a few just like it. Zencastr costs $20 a month right now but there is a limited free tier.
The other approach is to use something like Skype and then use something like ecamm call-recorder to record the conversation. The downside with this approach is that if you have any network trouble that messes up the audio, then you will also record that. However, Zencastr (and related services) do not work on iOS devices and other devices that use WebKit based browsers. So if you have someone calling in on a mobile device via Skype or something, then you’ll have to use this approach. Otherwise, I prefer the Zencastr approach and can’t really see any downside except for the cost.
Editing Software
There isn’t a lot of software that’s specifically designed for editing podcasts. I actually started off editing podcasts in Final Cut Pro X (nonlinear video editor) because that’s what I was familiar with. But now I use Logic Pro X, which is not really designed for podcasts, but it’s a real digital audio workstation and has nice features (like strip silence). But I think something like Audacity would be fine for basic editing.
The main thing I need to do with editing is merge the different audio tracks together and cut off any extraneous material at the beginning or the end. I don’t usually do a lot of editing in the middle unless there’s a major mishap like a siren goes by or a cat jumps on the computer. Once the editing is done I bounce to an AAC or MP3 file for uploading.
Hosting
You’ll need a service for hosting your audio files if you don’t have your own server. You can technically host your audio files anywhere, but specific services have niceties like auto-generating the RSS feed. For Not So Standard Deviations I use SoundCloud and for The Effort Report I use Libsyn.
Of the two services, I think I prefer Libsyn, because it’s specifically designed for podcasting and has somewhat better analytics. The web site feels a little bit like it was designed in 2003, but otherwise it works great. Libsyn also has features for things like advertising and subscriptions, but I don’t use any of those. SoundCloud is fine but wasn’t really designed for podcasting and sometimes feels a little unnatural.
Summary
If you’re interested in getting started in podcasting, here’s my bottom line:
- Get a partner. It’s more fun that way!
- If you and your partner are remote, use Zencastr or something similar.
- Splurge for the Zoom H4n if you can, otherwise get a reasonable cheap microphone like the Audio Technica or the Yeti.
- Don’t focus too much on editing. Just clip off the beginning and the end.
- Host on Libsyn.
15 Feb 2017
There’s an interesting article over at Bloomberg about how data scientists have struggled at some hedge funds:
The firms have been loading up on data scientists and coders to deliver on the promise of quantitative investing and lift their ho-hum returns. But they are discovering that the marriage of old-school managers and data-driven quants can be rocky. Managers who have relied on gut calls resist ceding control to scientists and their trading signals. And quants, emboldened by the success of computer-driven funds like Renaissance Technologies, bristle at their second-class status and vie for a bigger voice in investing.
There are some interesting tidbits in the article that I think hold lessons for any collaboration between a data scientist or analyst and a non-data scientist (for lack of a better word).
At Point72, the family office successor to SAC Capital, problems at the quant unit (known as Aperio):
The divide between Aperio quants and fundamental money managers was also intellectual. They struggled to communicate about the basics, like how big data could inform investment decisions. [Michael] Recce’s team, which was stacked with data scientists and coders, developed trading signals but didn’t always fully explain the margin of error in the analysis to make them useful to fund managers, the people said.
It’s hard to know the details of what actually happened, but for data scientists collaborating with others, there always needs to be an explanation of “what’s going on”. There’s a general feeling that it’s okay that machine learning techniques build complicated uninterpretable models because they work better. But in my experience that’s not enough. People want to know why they work better, when they work better, and when they don’t work.
On over-theorizing:
Haynes, who joined Stamford, Connecticut-based Point72 in early 2014 after about two decades at McKinsey & Co., and other senior managers grew dissatisfied with Aperio’s progress and impact on returns, the people said. When the group obtained new data sets, it spent too much time developing theories about how to process them rather than quickly producing actionable results.
I don’t necessarily agree with this “criticism”, but I only put it here because the land of hedge funds isn’t generally viewed on the outside as a place where lots of theorizing goes on.
At BlueMountain, another hedge fund:
When quants showed their risk analysis and trading signals to fundamental managers, they sometimes were rejected as nothing new, the people said. Quants at times wondered if managers simply didn’t want to give them credit for their ideas.
I’ve seen this quite a bit. When a data scientist presents results to collaborators, there’s often two responses:
- “I knew that already” and so you haven’t taught me anything new
- “I didn’t know that already” and so you must be wrong
The common link here, of course, is the inability to admit that there are things you don’t know. Whether this is an inherent character flaw or something that can be overcome through teaching is not yet clear to me. But it is common when data is brought to bear on a problem that previously lacked data. One of the key tasks that a data scientist in any industry must prepare for is the task of giving people information that will make them uncomfortable.
13 Feb 2017
Hilary and I discuss training in PhD programs, estimating the variance vs. the standard deviation, the bias variance tradeoff, and explainable machine learning.
We’re also introducing a new level of support on our Patreon page, where you can get access to some of the outtakes from our episodes. Check out our Patreon page for details.
Show notes:
Download the audio for this episode
Listen here:
01 Feb 2017
Over the past 10 years thinking and writing about reproducible research, I’ve come to the conclusion that much of the discussion is incomplete. While I think we as a scientific community have come a long way in changing people’s thinking about data and code and making them available to others, there are some key sticking points that keep coming up that are preventing further progress in the area.
When I used to write about reproducibility, I felt that the primary challenge/roadblock was a lack of tooling. Much has changed in just the last five years though, and many new tools have been developed to make life a lot easier. Packages like knitr (for R), markdown, and iPython notebooks, have made writing reproducible data analysis documents a lot easier. Web sites like GitHub and many others have made distributing analyses a lot simpler because now everyone effectively has a free web site (this was NOT true in 2005).
Even still, our basic definition of reproducibility is incomplete. Most people would say that a data analysis is reproducible if the analytic data and metadata are available and the code that did the analysis is available. Furthermore, it would be preferable to have some documentation to go along with both. But there are some key issues that need to be resolved to complete this general definition.
Reproducible for Whom?
In discussions about reproducibility with others, the topic of who should be able to reproduce the analysis only occasionally comes up. There’s a general sense, especially amongst academics, that anyone should be able to reproduce any analysis if they wanted to.
There is an analogy with free software here in the sense that free software can be free for some people and not for others. This made more sense in the days before the Internet when distribution was much more costly. The idea here was that I could write software for a client and give them the source code for that software (as they would surely demand). The software is free for them but not for anyone else. But free software ultimately only matters when it comes to distribution. Once I distribute a piece of software, that’s when all the restrictions come into play. However, if I only distribute it to a few people, I only need to guarantee that those few people have those freedoms.
Richard Stallman once said that something like 90% of software was free software because almost all software being written was custom software for individual clients (I have no idea where he got this number). Even if the number is wrong, the point still stands that if I write software for a single person, it can be free for that person even if no one in the world has access to the software.
Of course, now with the Internet, everything pretty much gets distributed to everyone because there’s nothing stopping someone from taking a piece of free software and posting it on a web site. But the idea still holds: Free software only needs to be free for the people who receive it.
That said, the analogy is not perfect. Software and research are not the same thing. They key difference is that you can’t call something research unless is generally available and disseminated. If Pfizer comes up with the cure for cancer and never tells anyone about it, it’s not research. If I discover that there’s a 9th planet and only tell my neighbor about it, it’s not research. Many companies might call those activities research (particularly from an tax/accounting point of view) but since society doesn’t get to learn about them, it’s not research.
If research is by definition disseminated to all, then it should therefore be reproducible by all. However, there are at least two circumstances in which we do not even pretend to believe this is possible.
- Imbalance of resources: If I conduct a data analysis that requires the world’s largest supercomputer, I can make all the code and data available that I want–few people will be able to actually reproduce it. That’s an extreme case, but even if I were to make use of a dramatically smaller computing cluster it’s unlikely that anyone would be able to recreate those resources. So I can distribute something that’s reproducible in theory but not in reality by most people.
- Protected data: Numerous analyses in the biomedical sciences make use of protected health information that cannot easily be disseminated. Privacy is an important issue, in part, because in many cases it allows us to collect the data in the first place. However, most would agree we cannot simply post that data for all to see in the name of reproducibility. First, it is against the law, and second it would likely deter anyone from agreeing to participate in any study in the future.
We can pretend that we can make data analyses reproducible for all, but in reality it’s not possible. So perhaps it would make sense for us to consider whether a limiting principle should be applied. The danger of not considering it is that one may take things to the extreme—if it can’t be made reproducible for all, then why bother trying? A partial solution is needed here.
For How Long?
Another question that needs to be resolved for reproducibility to be a widely implemented and sustainable phenomenon is for how long should something be reproducible? Ultimately, this is a question about time and resources because ensuring that data and code can be made available and can run on current platforms in perpetuity requires substantial time and money. In the academic community, where projects are often funded off of grants or contracts with finite lifespans, often the money is long gone even though the data and code must be maintained. The question then is who pays for the maintainence and the upkeep of the data and code?
I’ve never heard a satisfactory answer to this question. If the answer is that data analyses should be reproducible forever, then we need to consider a different funding model. This position would require a perpetual funds model, essentially an endowment, for each project that is disseminated and claims to be reproducible. The endowment would pay for things like servers for hosting the code and data and perhaps engineers to adapt and adjust the code as the surrounding environment changes. While there are a number of repositories that have developed scalable operating models, it’s not clear to me that the funding model is completely sustainable.
If we look at how scientific publications are sustained, we see that it’s largely private enterprise that shoulders the burden. Journals house most of the publications out there and they charge a fee for access (some for profit, some not for profit). Whether the reader pays or the author pays is not relevant, the point is that a decision has been made about who pays.
The author-pays model is interesting though. Here, an author pays a publication charge of ~$2,000, and the reader never pays anything for access (in perpetuity, presumably). The $2,000 payment by the author is like a one-time capital expense for maintaining that one publication forever (a mini-endowment, in a sense). It works for authors because grant/contract supported research often budget for one-time publication charges. There’s no need for continued payments after a grant/contract has expired.
The publication system is quite a bit simpler because almost all publications are the same size and require the same resources for access—basically a web site that can serve up PDF files and people to maintain it. For data analyses, one could see things potentially getting out of control. For a large analysis with terabytes of data, what would the one-time up-front fee be to house the data and pay for anyone to access it for free forever?
Using Amazon’s monthly cost estimator we can get a rough sense of what the pure data storage might cost. Suppose we have a 10GB dataset that we want to store and we anticipate that it might be downloaded 10 times per month. This would cost about $7.65 per month, or $91.80 per year. If we assume Amazon raises their prices about 3% per year and a discount rate of 5%, the total cost for the storage is $4,590. If we tack on 20% for other costs, that brings us to $5,508. This is perhaps not unreasonable, and the scenario would certainly include most people. For comparison a 1 TB dataset downloaded once a year, using the same formula gives us a one-time cost of about $40,000. This is real money when it comes to fixed research budgets and would likely require some discussion of trade-offs.
Summary
Reproducibility is a necessity in science, but it’s high time that we start considering the practical implications of actually doing the job. There are still holdouts when it comes to the basic idea of reproducibiltiy, but they are fewer and farther between. If we do not seriously consider the details of how to implement reproducibility, perhaps by introducing some limiting principles, we may never be able to achieve any sort of widespread adoption.
31 Jan 2017
Editor’s note: This is the third chapter of a book I’m working on called Demystifying Artificial Intelligence. The goal of the book is to demystify what modern AI is and does for a general audience. So something to smooth the transition between AI fiction and highly mathematical descriptions of deep learning. I’m developing the book over time - so if you buy the book on Leanpub know that there are only three chapters in there so far, but I’ll be adding more over the next few weeks and you get free updates. The cover of the book was inspired by this amazing tweet by Twitter user @notajf. Feedback is welcome and encouraged!
“It is a capital mistake to theorize before one has data.” Arthur Conan Doyle
Data, data everywhere
I already have some data about you. You are reading this book. Does that seem like data? It’s just something you did, that’s not data is it? But if I collect that piece of information about you, it actually tells me a surprising amount. It tells me you have access to an internet connection, since the only place to get the book is online. That in turn tells me something about your socioeconomic status and what part of the world you live in. It also tells me that you like to read, which suggests a certain level of education.
Whether you know it or not, everything you do produces data - from the websites you read to the rate at which your heart beats. Until pretty recently, most of the data you produced wasn’t collected, it floated off unmeasured. Data were painstakingly gathered by scientists one number at a time in small experiments with a few people. This laborious process meant that data were expensive and time-consuming to collect. Yet many of the most amazing scientific discoveries over the last two centuries were squeezed from just a few data points. But over the last two decades, the unit price of data has dramatically dropped. New technologies touching every aspect of our lives from our money, to our health, to our social interactions have made data collection cheap and easy.
To give you an idea of how steep the drop in the price of data has been, in 1967 Stanley Milgram did an experiment to determine the number of degrees of separation between two people in the U.S. (Travers and Milgram 1969). In his experiment he sent 296 letters to people in Omaha, Nebraska and Wichita, Kansas. The goal was to get the letters to a specific person in Boston, Massachusetts. The trick was people had to send the letters to someone they knew, and they then sent it to someone they knew and so on. At the end of the experiment, only 64 letters made it to the individual in Boston. On average, the letters had gone through 6 people to get there.
This is an idea that is so powerful it even became part of the popular consciousness. For example it is the foundation of the internet meme “the 6-degrees of Kevin Bacon” (Wikipedia contributors 2016a) - the idea that if you take any actor and look at the people they have been in movies with, then the people those people have been in movies with, it will take you at most six steps to end up at the actor Kevin Bacon. This idea, despite its popularity was originally studied by Milgram using only 64 data points. A 2007 study updated that number to “7 degrees of Kevin Bacon”. The study was based on 30 billion instant messaging conversations collected over the course of a month or two with the same amount of effort (Leskovec and Horvitz 2008).
Once data started getting cheaper to collect, it got cheaper fast. Take another example, the human genome. The genome is the unique DNA code in every one of your cells. It consists of a set of 3 billion letters that is unique to you. By many measures, the race to be the first group to collect all 3 billion letters from a single person kicked off the data revolution in biology. The project was completed in 2000 after a decade of work and $3 billion to collect the 3 billion letters in the first human genome (Venter et al. 2001). This project was actually a stunning success, most people thought it would be much more expensive. But just over a decade later, new technology means that we can now collect all 3 billion letters from a person’s genome for about $1,000 in about a week (“The Cost of Sequencing a Human Genome,” n.d.), soon it may be less than $100 (Buhr 2017).
You may have heard that this is the era of “big data” from The Economist or The New York Times. It is really the era of cheap data collection and storage. Measurements we never bothered to collect before are now so easy to obtain that there is no reason not to collect them. Advances in computer technology also make it easier to store huge amounts of data digitally. This may not seem like a big deal, but it is much easier to calculate the average of a bunch of numbers stored electronically than it is to calculate that same average by hand on a piece of paper. Couple these advances with the free and open distribution of data over the internet and it is no surprise that we are awash in data. But tons of data on their own are meaningless. It is understanding and interpreting the data where the real advances start to happen.
This explosive growth in data collection is one of the key driving influences behind interest in artificial intelligence. When teaching computers to do something that only humans could do previously, it helps to have lots of examples. You can then use statistical and machine learning models to summarize that set of examples and help a computer make decisions what to do. The more examples you have, the more flexible your computer model can be in making decisions, and the more “intelligent” the resulting application.
What is data?
Tidy data
“What is data”? Seems like a relatively simple question. In some ways this question is easy to answer. According to Wikipedia:
Data (/ˈdeɪtə/ day-tə, /ˈdætə/ da-tə, or /ˈdɑːtə/ dah-tə)[1] is a set of values of qualitative or quantitative variables. An example of qualitative data would be an anthropologist’s handwritten notes about her interviews with people of an Indigenous tribe. Pieces of data are individual pieces of information. While the concept of data is commonly associated with scientific research, data is collected by a huge range of organizations and institutions, ranging from businesses (e.g., sales data, revenue, profits, stock price), governments (e.g., crime rates, unemployment rates, literacy rates) and non-governmental organizations (e.g., censuses of the number of homeless people by non-profit organizations).
When you think about data, you probably think of orderly sets of numbers arranged in something like an Excel spreadsheet. In the world of data science and machine learning this type of data has a name - “tidy data” (Wickham and others 2014). Tidy data has the properties that all measured quantities are represented by numbers or character strings (think words). The data are organized such that.
- Each variable you measured is in one column
- Each different measurement of that variable is in a different row
- There is one data table for each “type” of variable.
- If there are multiple tables then they are linked by a common ID.
This idea is borrowed from data management schemas that have long been used for storing data in databases. Here is an example of a tidy data set of swimming world records.
| year |
time |
sex |
| 1905 |
65.8 |
M |
| 1908 |
65.6 |
M |
| 1910 |
62.8 |
M |
| 1912 |
61.6 |
M |
| 1918 |
61.4 |
M |
| 1920 |
60.4 |
M |
| 1922 |
58.6 |
M |
| 1924 |
57.4 |
M |
| 1934 |
56.8 |
M |
| 1935 |
56.6 |
M |
This type of data, neat, organized and nicely numeric is not the kind of data people are talking about when they say the “era of big data”. Data almost never start their lives in such a neat and organized format.
Raw data
The explosion of interest in AI has been powered by a variety of types of data that you might not even think of when you think of “data”. The data might be pictures you take and upload to social media, the text of the posts on that same platform, or the sound captured from your voice when you speak to your phone.
Social media and cell phones aren’t the only area where data is being collected more frequently. Speed cameras on roads collect data on the movement of cars, electronic medical records store information about people’s health, wearable devices like Fitbit collect information on the activity of people. GPS information stores the location of people, cars, boats, airplanes, and an increasingly wide array of other objects.
Images, voice recordings, text files, and GPS coordinates are what experts call “raw data”. To create an artificial intelligence application you need to begin with a lot of raw data. But as we discussed in the simple AI example from the previous chapter - a computer doesn’t understand raw data in its natural form. It is not always immediately obvious how the raw data can be turned into numbers that a computer can understand. For example, when an artificial intelligence works with a picture the computer doesn’t “see” the picture file itself. It sees a set of numbers that represent that picture and operates on those numbers. The first step in almost every artificial intelligence application is to “pre-process” the data - to take the image files or the movie files or the text of a document and turn it into numbers that a computer can understand. Then those numbers can be fed into algorithms that can make predictions and ultimately be used to make an interface look intelligent.
Turning raw data into numbers
So how do we convert raw data into a form we can work with? It depends on what type of measurement or data you have collected. Here I will use two examples to explain how you can convert images and the text of a document into numbers that an algorithm can be applied to.
Images
Suppose that we were developing an AI to identify pictures of the author of this book. We would need to collect a picture of the author - maybe an embarrassing one.
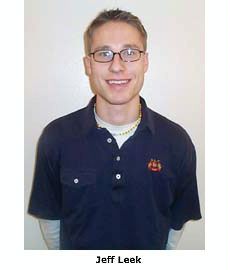
This picture is made of pixels. You can see that if you zoom in very close on the image and look more closely. You can see that the image consists of many hundreds of little squares, each square just one color. Those squares are called pixels and they are one step closer to turning the image into numbers.

You can think of each pixel like a dot of color. Let’s zoom in a little bit more and instead of showing each pixel as a square show each one as a colored dot.

Imagine we are going to build an AI application on the basis of lots of images. Then we would like to turn a set of images into “tidy data”. As described above a tidy data set is defined as the following.
- Each variable you measured is in one column
- Each different measurement of that variable is in a different row
- There is one data table for each “type” of variable.
- If there are multiple tables then they are linked by a common ID.
A translation of tidy data for a collection of images would be the following.
- Variables: Are the pixels measured in the images. So the top left pixel is a variable, the bottom left pixel is a variable, and so on. So each pixel should be in a separate column.
- Measurements: The measurements are the values for each pixel in each image. So each row corresponds to the values of the pixels for each row.
- Tables: There would be two tables - one with the data from the pixels and one with the labels of each image (if we know them).
To start to turn the image into a row of the data set we need to stretch the dots into a single row. One way to do this is to snake along the image going from top left corner to bottom right corner and creating a single line of dots.
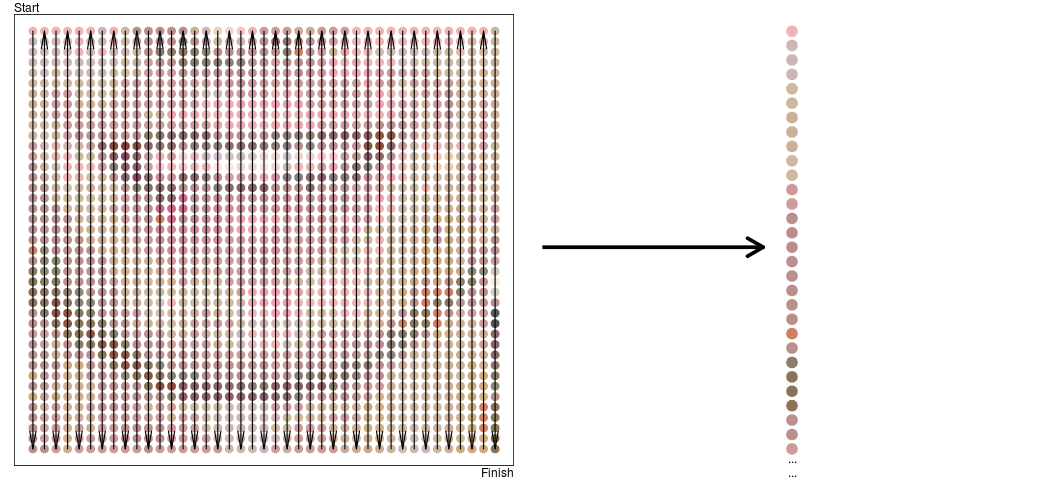
This still isn’t quite data a computer can understand - a computer doesn’t know about dots. But we could take each dot and label it with a color name.
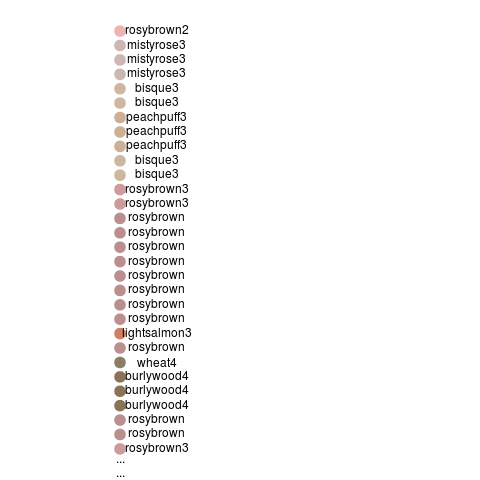
We could take each color name and give it a number, something like rosybrown = 1, mistyrose = 2, and so on. This approach runs into some trouble because we don’t have names for every possible color and because it is pretty inefficient to have a different number for every hue we could imagine.
But that would be both inefficient and not very understandable by a computer. An alternative strategy that is often used is to encode the intensity of the red, green, and blue colors for each pixel. This is sometimes called the rgb color model (Wikipedia contributors 2016b). So for example we can take these dots and show how much red, green, and blue they have in them.
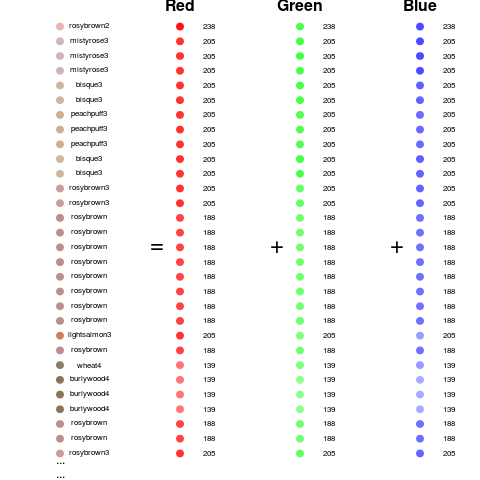
Looking at it this way we now have three measurements for each pixel. So we need to update our tidy data definition to be:
- Variables: Are the three colors for each pixel measured in the images. So the top left pixel red value is a variable, the top left pixel green value is a variable and so on. So each pixel/color combination should be in a separate column.
- Measurements: The measurements are the values for each pixel in each image. So each row corresponds to the values of the pixels for each row.
- Tables: There would be two tables - one with the data from the pixels and one with the labels of each image (if we know them).
So a tidy data set might look something like this for just the image of Jeff.
| id |
label |
p1red |
p1green |
p1blue |
p2red |
… |
| 1 |
“jeff” |
238 |
180 |
180 |
205 |
… |
Each additional image would then be another row in the data set. As we will see in the chapters that follow we can then feed this data into an algorithm for performing an artificial intelligence task.
Notes
Parts of this chapter from appeared in the Simply Statistics blog post “The vast majority of statistical analysis is not performed by statisticians” written by the author of this book.
References
Buhr, Sarah. 2017. “Illumina Wants to Sequence Your Whole Genome for $100.” https://techcrunch.com/2017/01/10/illumina-wants-to-sequence-your-whole-genome-for-100/.
Leskovec, Jure, and Eric Horvitz. 2008. “Planetary-Scale Views on an Instant-Messaging Network,” 6~mar.
“The Cost of Sequencing a Human Genome.” n.d. https://www.genome.gov/sequencingcosts/.
Travers, Jeffrey, and Stanley Milgram. 1969. “An Experimental Study of the Small World Problem.” Sociometry 32 (4). [American Sociological Association, Sage Publications, Inc.]: 425–43.
Venter, J Craig, Mark D Adams, Eugene W Myers, Peter W Li, Richard J Mural, Granger G Sutton, Hamilton O Smith, et al. 2001. “The Sequence of the Human Genome.” Science 291 (5507). American Association for the Advancement of Science: 1304–51.
Wickham, Hadley, and others. 2014. “Tidy Data.” Under Review.
Wikipedia contributors. 2016a. “Six Degrees of Kevin Bacon.” https://en.wikipedia.org/w/index.php?title=Six_Degrees_of_Kevin_Bacon&oldid=748831516.
———. 2016b. “RGB Color Model.” https://en.wikipedia.org/w/index.php?title=RGB_color_model&oldid=756764504.
 Follow us on twitter