 Follow us on twitter
 The Evolution of a Data Scientist
21 Mar 2016Editor’s note: This post is a guest post by Andrew Jaffe
“How do you get to Carnegie Hall? Practice, practice, practice.” (“The Wit Parade” by E.E. Kenyon on March 13, 1955)
”..an extraordinarily consistent answer in an incredible number of fields … you need to have practiced, to have apprenticed, for 10,000 hours before you get good.” (Malcolm Gladwell, on Outliers)
I have been a data scientist for the last seven or eight years, probably before “data science” existed as a field. I work almost exclusively in the R statistical environment which I first toyed with as a sophomore in college, which ramped up through graduate school. I write all of my code in Notepad++ and make all of my plots with base R graphics, over newer and probably easier approaches, like R Studio, ggplot2, and R Markdown. Every so often, someone will email asking for code used in papers for analysis or plots, and I dig through old folders to track it down. Every time this happens, I come to two realizations: 1) I used to write fairly inefficient and not-so-great code as an early PhD student, and 2) I write a lot of R code.
I think there are some pretty good ways of measuring success and growth as a data scientist – you can count software packages and their user-bases, projects and papers, citations, grants, and promotions. But I wanted to calculate one more metric to add to the list – how much R code have I written in the last 8 years? I have been using the Joint High Performance Computing Exchange (JHPCE) at Johns Hopkins University since I started graduate school, so all of my R code was pretty much all in one place. I therefore decided to spend my Friday night drinking some Guinness and chronicling my journey using R and evolution as a data scientist.
I found all of the .R files across my four main directories on the computing cluster (after copying over my local scripts), and then removed files that came with packages, that belonged to other users, and that resulted from poorly designed simulation and permutation analyses (perm1.R,…,perm100.R) before I learned how to use array jobs, and then extracted the creation date, last modified date, file size, and line count for each R script. Based on this analysis, I have written 3257 R scripts across 13.4 megabytes and 432,753 lines of code (including whitespace and comments) since February 22, 2009.
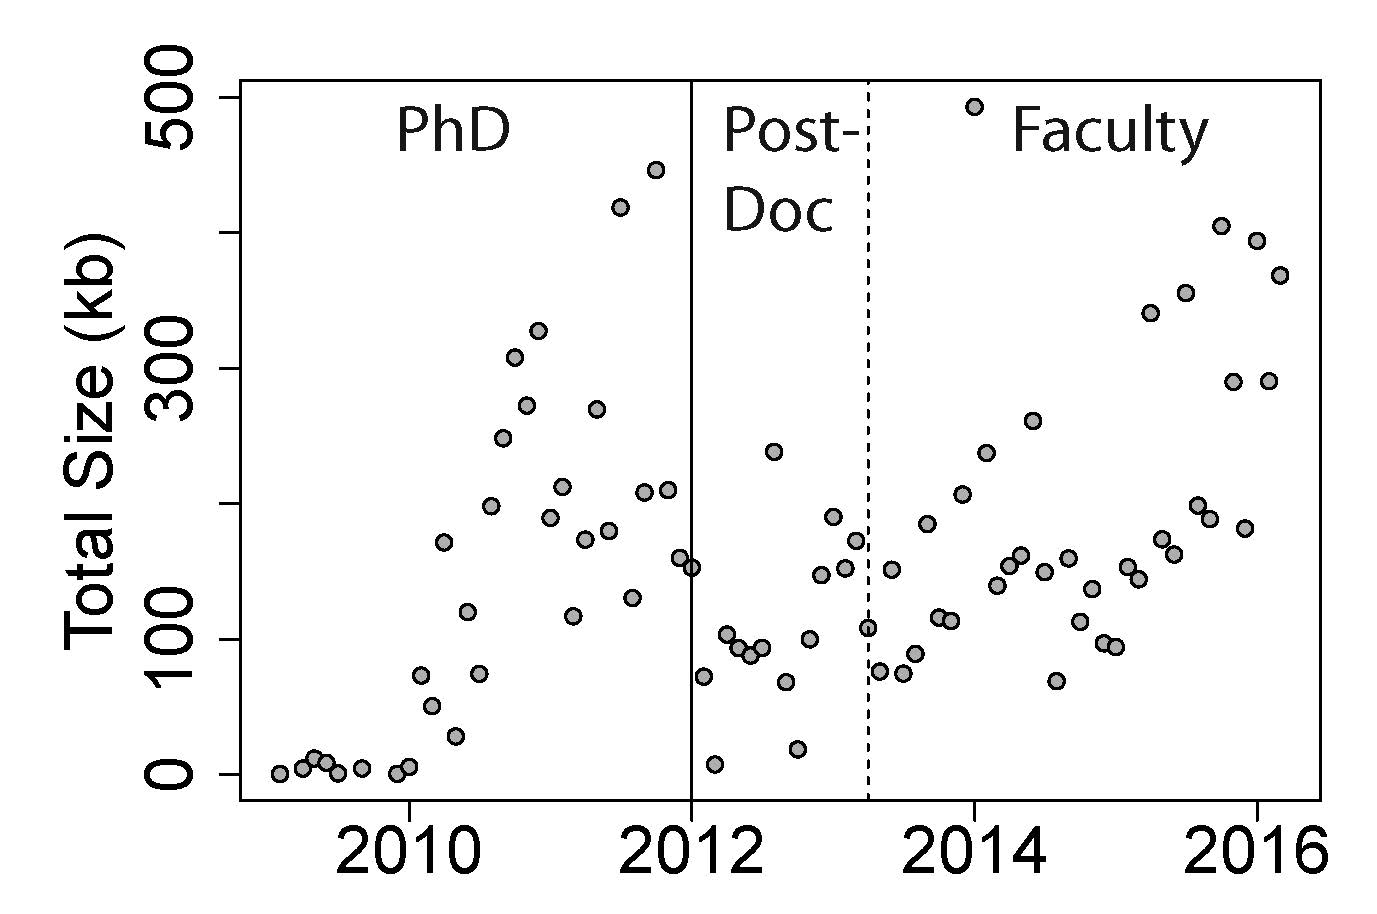
I found that my R coding output has generally increased over time when tabulated by month (number of scripts: p=6.3e-7, size of files: p=3.5x10⁻⁹, and number of lines: p=5.0e-9). These metrics of coding – number, size, and lines - also suggest that, on average, I wrote the most code during my PhD (p-value range: 1.7e-4-1.8e-7). Interestingly, the changes in output over time surprisingly consistent across the three phases of my academic career: PhD, postdoc, and faculty (see Figure 1) – you can see the initial dropoff in production during the first one or two months as I transitioned to a postdoc at the Lieber Institute for Brain Development after finishing my PhD. My output rate has dropped slightly as a faculty member as I started working with doctoral students who took over the analyses of some projects (month-by-output interaction p-value: 5.3e-4, 0.002, and 0.03, respectively, for number, size, and lines). The mean coding output – on average, how much code it takes for a single analysis – were also increased over time and slightly decreased at LIBD, although to lesser extents (all p-values were between 0.01-0.05). I was actually surprised that coding output increased – rather than decreased – over time, as any gains in coding efficiency were probably canceled out my often times more modular analyses at LIBD.
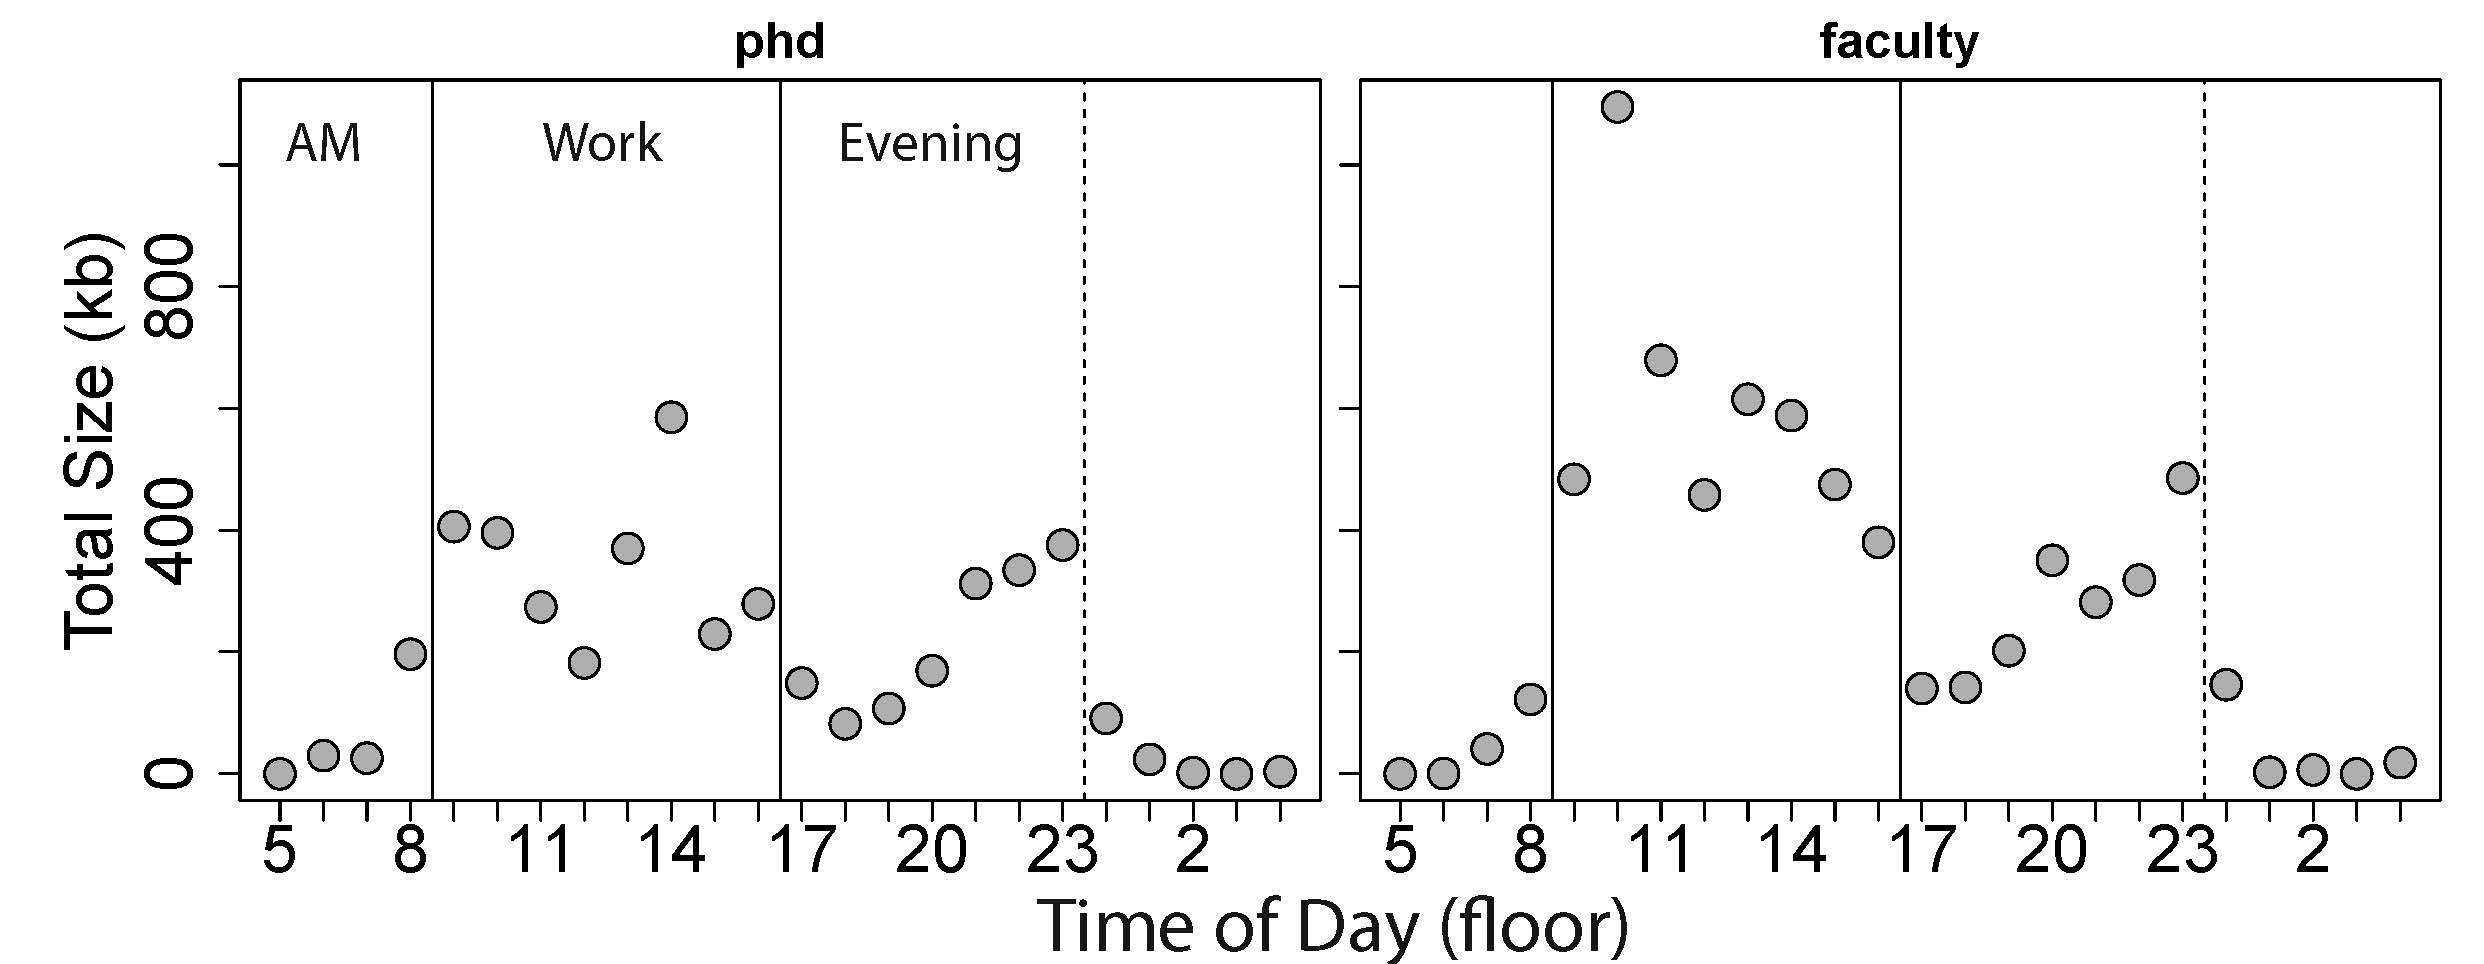
I also looked at coding output by hour of the day to better characterize my working habits – the output per hour is shown stratified by the two eras each about ~3 years (Figure 2). As expected, I never really work much in the morning – very little work get done before 8AM – and little has changed since a second year PhD student. As a faculty member, I have the highest output between 9AM-3PM. The trough between 4PM and 7PM likely corresponds to walking the dog we got three years ago, working out, and cooking (and eating) dinner. The output then increases steadily from 8PM-12AM, where I can work largely uninterrupted from meetings and people dropping by my office, with occasional days (or nights) working until 1AM.
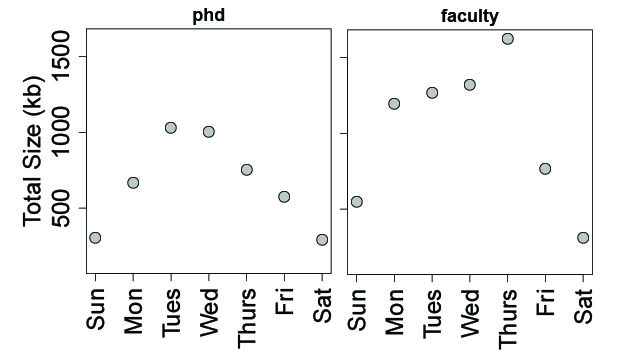
Lastly, I examined R coding output by day of the week. As expected, the lowest output occurred over the weekend, especially on Saturdays. Interestingly, I tended to increase output later in the work week as a faculty member, and also work a little more on Sundays and Mondays, compared to a PhD student.
Looking at the code itself, of the 432,753 lines, 84,343 were newlines (19.5%), 66,900 were lines that were exclusively comments (15.5%), and an additional 6,994 lines contained comments following R code (1.6%). Some of my most used syntax and symbols, as line counts containing at least one symbol, were pretty much as expected (dropping commas and requiring whitespace between characters):
| Code | Count | Code | Count |
| = | 175604 | == | 5542 |
| # | 48763 | < | 5039 |
| <- | 16492 | for(i | 5012 |
| { | 11879 | & | 4803 |
| } | 11612 | the | 4734 |
| in | 10587 | function(x) | 4591 |
| ## | 8508 | ### | 4105 |
| ~ | 6948 | - | 4034 |
| > | 5621 | %in% | 3896 |
My code is available on GitHub: https://github.com/andrewejaffe/how-many-lines (after removing file paths and names, as many of the projects are currently unpublished and many files are placed in folders named by collaborator), so feel free to give it a try and see how much R code you’ve written over your career. While there are probably a lot more things to play around with and explore, this was about all the time I could commit to this, given other responsibilities (I’m not on sabbatical like Jeff Leek…). All in all, this was a pretty fun experience and largely reflected, with data, how my R skills and experience have progressed over the years.