 Follow us on twitter
 Logo Contest Winner
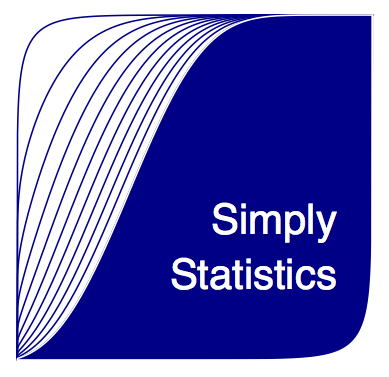
16 Nov 2012Congratulations to Bradley Saul, the winner of the Simply Statistics Logo contest! We had some great entries which made it difficult to choose between them. You can see the new logo to the right of our home page or the full sized version here:
I made some slight modifications to Bradley’s original code (apologies!). The code for his original version is here:
Here’s the code:
#########################################################
#  Project: Simply Statistics Logo Design
#  Date: 10/17/12
#  Version: 0.00001
#  Author: Bradley Saul
#  Built in R Version: 2.15.0
#########################################################

#Set Graphical parameters
par(mar=c(0, 0, 0, 0), pty='s', cex=3.5, pin=c(6,6))
#Note: I had to hard code the size, so that the text would scale
#on resizing the image. Maybe there is another way to get around font
#scaling issues - I couldn't figure it out.

make_logo <- function(color){

  x1 <- seq(0,1,.001)
  ncps <- seq(0,10,1)
  shapes <- seq(5,15,1)
  # Plot Beta distributions to make purty lines.
  plot(x1, pbeta(x1, shape1=10, shape2=.1, ncp=0), type='l', xlab='', ylab='',
       frame.plot=FALSE, axes=FALSE)
  for(i in 1:length(ncps)){
    lines(x1, pbeta(x1,shape1=.1, shape2=10, ncp=ncps[i]), col=color)
  }

  #Shade in area under curve.
  coord.x <- c(0,x1,1)
  coord.y <- c(0,pbeta(x1,shape1=.1,shape2=10, ncp=10),0)
  polygon(coord.x, coord.y, col=color, border="white")

  #Lazy way to get area between curves shaded, rather than just area under curve.
  coord.y2 <- c(0,pbeta(x1,shape1=10,shape2=.1, ncp=0),0)
  polygon(coord.x, coord.y2, col="white", border="white")

  #Add text
  text(.98,.4,'Simply', col="white", adj=1,family='HersheySerif')
  text(.98,.25,'St*atistics', col="white", adj=1, family="HersheySerif")
}
Thanks to Bradley for the great logo and congratulations!