On weather forecasts, Nate Silver, and the politicization of statistical illiteracy
30 Oct 2012As you know, we have a thing for statistical literacy here at Simply Stats. So of course this column over at Politico got our attention (via Chris V. and others). The column is an attack on Nate Silver, who has a blog where he tries to predict the outcome of elections in the U.S., you may have heard of it…
The argument that Dylan Byers makes in the Politico column is that Nate Silver is likely to be embarrassed by the outcome of the election if Romney wins. The reason is that Silver’s predictions have suggested Obama has a 75% chance to win the election recently and that number has never dropped below 60% or so.
I don’t know much about Dylan Byers, but from reading this column and a quick scan of his twitter feed, it appears he doesn’t know much about statistics. Some people have gotten pretty upset at him on Twitter and elsewhere about this fact, but I’d like to take a different approach: education. So Dylan, here is a really simple example that explains how Nate Silver comes up with a number like the 75% chance of victory for Obama.
Let’s pretend, just to make the example really simple, that if Obama gets greater than 50% of the vote, he will win the election. Obviously, Silver doesn’t ignore the electoral college and all the other complications, but it makes our example simpler. Then assume that based on averaging a bunch of polls we estimate that Obama is likely to get about 50.5% of the vote.
Now, we want to know what is the “percent chance” Obama will win, taking into account what we know. So let’s run a bunch of “simulated elections” where on average Obama gets 50.5% of the vote, but there is variability because we don’t have the exact number. Since we have a bunch of polls and we averaged them, we can get an estimate for how variable the 50.5% number is. The usual measure of variance is the standard deviation. Say we get a standard deviation of 1% for our estimate. That would be a pretty accurate number, but not totally unreasonable given the amount of polling data out there.
We can run 1,000 simulated elections like this in R* (a free software programming language, if you don’t know R, may I suggest Roger’s Computing for Data Analysis class?). Here is the code to do that. The last line of code calculates the percent of times, in our 1,000 simulated elections, that Obama wins. This is the number that Nate would report on his site. When I run the code, I get an Obama win 68% of the time (Obama gets greater than 50% of the vote). But if you run it again that number will vary a little, since we simulated elections.
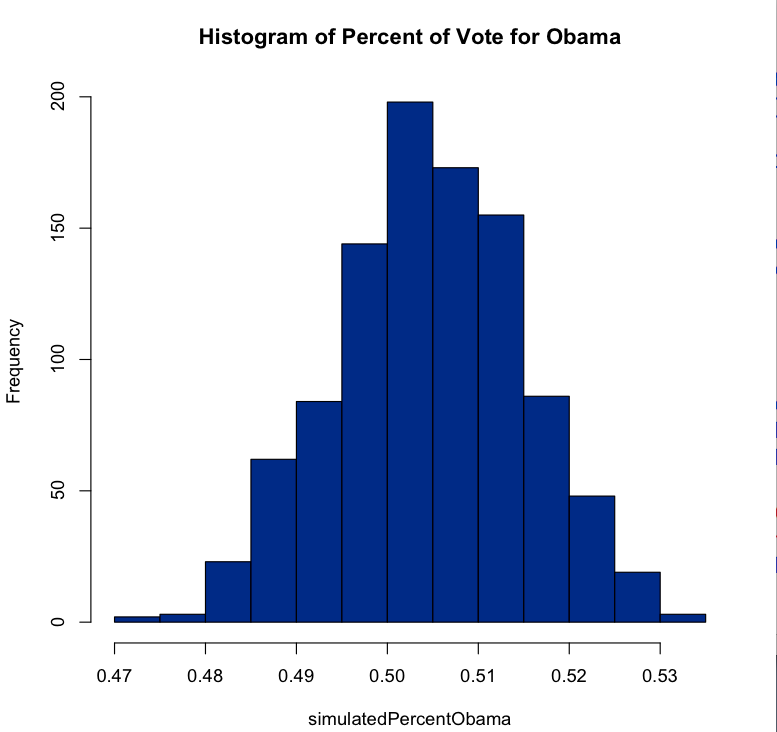
The interesting thing is that even though we only estimate that Obama leads by about 0.5%, he wins 68% of the simulated elections. The reason is that we are pretty confident in that number, with our standard deviation being so low (1%). But that doesn’t mean that Obama will win 68% of the vote in any of the elections! In fact, here is a histogram of the percent of the vote that Obama wins:

He never gets more than 54% or so and never less than 47% or so. So it is always a reasonably close election. Silver’s calculations are obviously more complicated, but the basic idea of simulating elections is the same.
Now, this might seem like a goofy way to come up with a “percent chance” with simulated elections and all. But it turns out it is actually a pretty important thing to know and relevant to those of us on the East Coast right now. It turns out weather forecasts (and projected hurricane paths) are based on the same sort of thing - simulated versions of the weather are run and the “percent chance of rain” is the fraction of times it rains in a particular place.
So Romney may still win and Obama may lose - and Silver may still get a lot of it right. But regardless, the approach taken by Silver is not based on politics, it is based on statistics. Hopefully we can move away from politicizing statistical illiteracy and toward evaluating the models for the real, underlying assumptions they make.
* In this case, we could calculate the percent of times Obama would win with a formula (called an analytical calculation) since we have simplified so much. In Nate’s case it is much more complicated, so you have to simulate.
 Follow us on twitter