 Follow us on twitter
 An R function to map your Twitter Followers
21 Dec 2011I wrote a little function to make a personalized map of who follows you or who you follow on Twitter. The idea for this function was inspired by some plots I discussed in a previous post. I also found a lot of really useful code over at flowing data here.
The function uses the packages twitteR, maps, geosphere, and RColorBrewer. If you don’t have the packages installed, when you source the twitterMap code, it will try to install them for you. The code also requires you to have a working internet connection.
One word of warning is that if you have a large number of followers or people you follow, you may be rate limited by Twitter and unable to make the plot.
To make your personalized twitter map, first source the function:
source(“http://biostat.jhsph.edu/~jleek/code/twitterMap.R”)
The function has the following form:
twitterMap <- function(userName,userLocation=NULL,fileName=”twitterMap.pdf”,nMax = 1000,plotType=c(“followers”,”both”,”following”))
with arguments:
- userName - the twitter username you want to plot
- userLocation - an optional argument giving the location of the user, necessary when the location information you have provided Twitter isn’t sufficient for us to find latitude/longitude data
- fileName - the file where you want the plot to appear
- nMax - The maximum number of followers/following to get from Twitter, this is implemented to avoid rate limiting for people with large numbers of followers.
- plotType - if “both” both followers/following are plotted, etc.
Then you can create a plot with both followers/following like so:
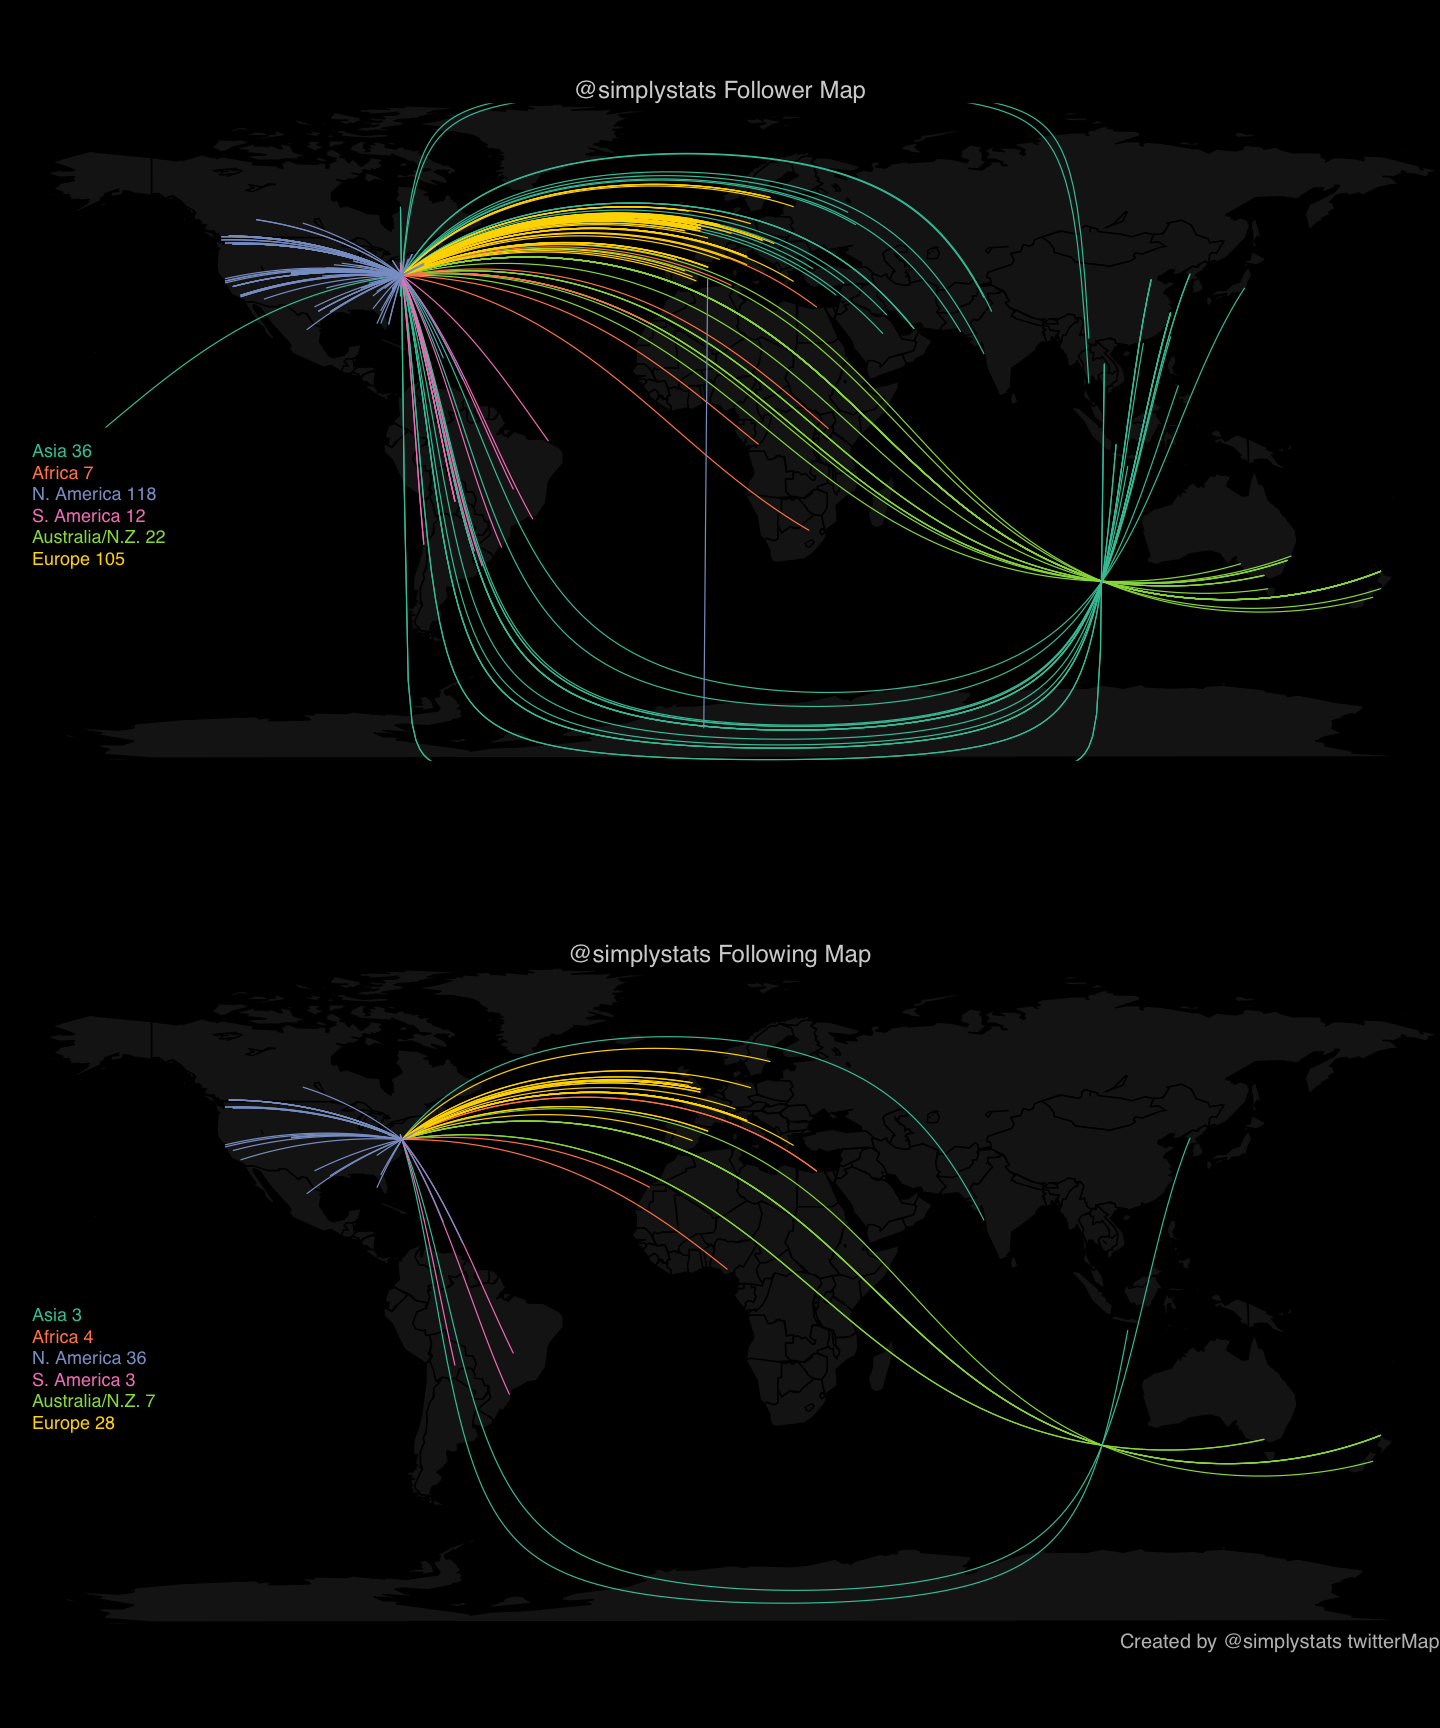
twitterMap(“simplystats”)
Here is what the resulting plot looks like for our Twitter Account:
If your location can’t be found or latitude longitude can’t be calculated, you may have to chose a bigger city near you. The list of cities used by twitterMap can be found like so:
library(maps)
data(world.cities)
grep(“Baltimore”, world.cities[,1])
If your city is in the database, this will return the row number of the world.cities data frame corresponding to your city.