Follow us on twitter
 Plotting BeijingAir Data
08 Dec 2011Here’s a bit of R code for scraping the BejingAir Twitter feed and plotting the hourly PM2.5 values for the past 24 hours. The script defaults to the past 24 hours but you can modify that by simply changing the value for the variable ‘n’.
You can just grab the code from this R script. Note that you need to use the latest version of the ‘twitteR’ package because the data structure has changed from previous versions.
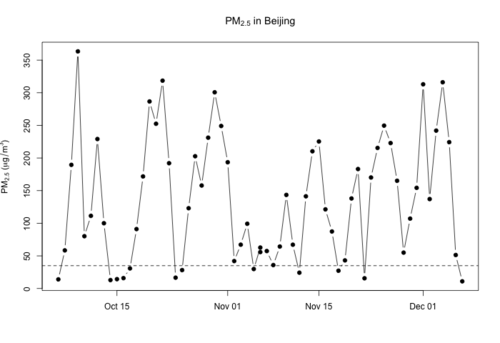
Using a modified version of the code in the script, I made a plot of the 24-hour average PM2.5 levels in Beijing over the last 2 months or so. The dashed line shows the US national ambient air quality standard for 24-hour average PM2.5. Note that the plot below is 24-hour averages so it is comparable to the US standard and also looks (somewhat) less extreme than the hourly values.