09 Nov 2016
Four years ago we
posted
on Nate Silver’s, and other forecasters’, triumph over pundits. In
contrast, after yesterday’s presidential election, results contradicted
most polls and data-driven forecasters, several news articles came out
wondering how this happened. It is important to point
out that not all forecasters got it wrong. Statistically
speaking, Nate Silver, once again, got it right.
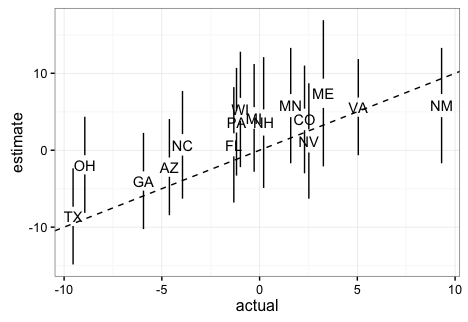
To show this, below I include a plot showing the expected margin of
victory for Clinton versus the actual results for the most competitive states provided by 538. It includes the uncertainty bands provided by 538 in
this site
(I eyeballed the band sizes to make the plot in R, so they are not
exactly like 538’s).

Note that if these are 95% confidence/credible intervals, 538 got 1
wrong. This is exactly what we expect since 15/16 is about
95%. Furthermore, judging by the plot here, 538 estimated the popular vote margin to be 3.6%
with a confidence/credible interval of about 5%.
This too was an accurate
prediction since Clinton is going to win the popular vote by
about 1% 0.5% (note this final result is in the margin of error of
several traditional polls as well). Finally, when other forecasters were
giving Trump between 14% and 0.1% chances of winning, 538 gave
him about a
30% chance which is slightly more than what a team has when down 3-2
in the World Series. In contrast, in 2012 538 gave Romney only a 9%
chance of winning. Also, remember, if in ten election cycles you
call it for someone with a 70% chance, you should get it wrong 3
times. If you get it right every time then your 70% statement was wrong.
So how did 538 outperform all other forecasters? First, as far as I
can tell they model the possibility of an overall bias, modeled as a
random effect, that affects
every state. This bias can be introduced by systematic
lying to pollsters or under sampling some group. Note that this bias
can’t be estimated from data from
one election cycle but it’s variability can be estimated from
historical data. 538 appear
to estimate the standard error of this term to be
about 2%. More details on this are included here. In 2016 we saw this bias and you can see it in
the plot above (more points are above the line than below). The
confidence bands account for this source of variabilty and furthermore
their simulations account for the strong correlation you will see
across states: the chance of seeing an upset in Pennsylvania, Wisconsin,
and Michigan is not the product of an upset in each. In
fact it’s much higher. Another advantage 538 had is that they somehow
were able to predict a systematic, not random, bias against
Trump. You can see this by
comparing their adjusted data to the raw data (the adjustment favored
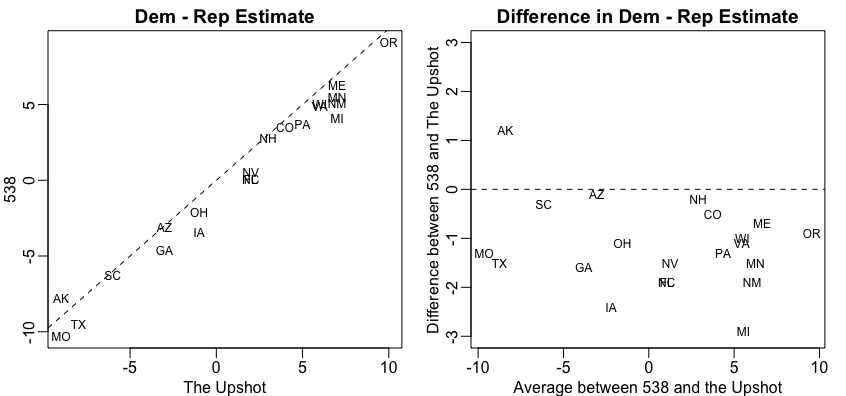
Trump about 1.5 on average). We can clearly see this when comparing the 538
estimates to The Upshots’:

The fact that 538 did so much better than other forecasters should
remind us how hard it is to do data analysis in real life. Knowing
math, statistics and programming is not enough. It requires experience
and a deep understanding of the nuances related to the specific
problem at hand. Nate Silver and the 538 team seem to understand this
more than others.
Update: Jason Merkin points out (via Twitter) that 538 provides 80% credible
intervals.
08 Nov 2016
My friend Fernando showed me his collection of old Apple dongles that no longer work with the latest generation of Apple devices. This coupled with the announcement of the Macbook pro that promises way more dongles and mostly the same computing, had me freaking out about my computing platform for the future. I’ve been using cloudy tools for more and more of what I do and so it had me wondering if it was time to go back and try my Chromebook experiment again. Basically the question is whether I can do everything I need to do comfortably on a Chromebook.
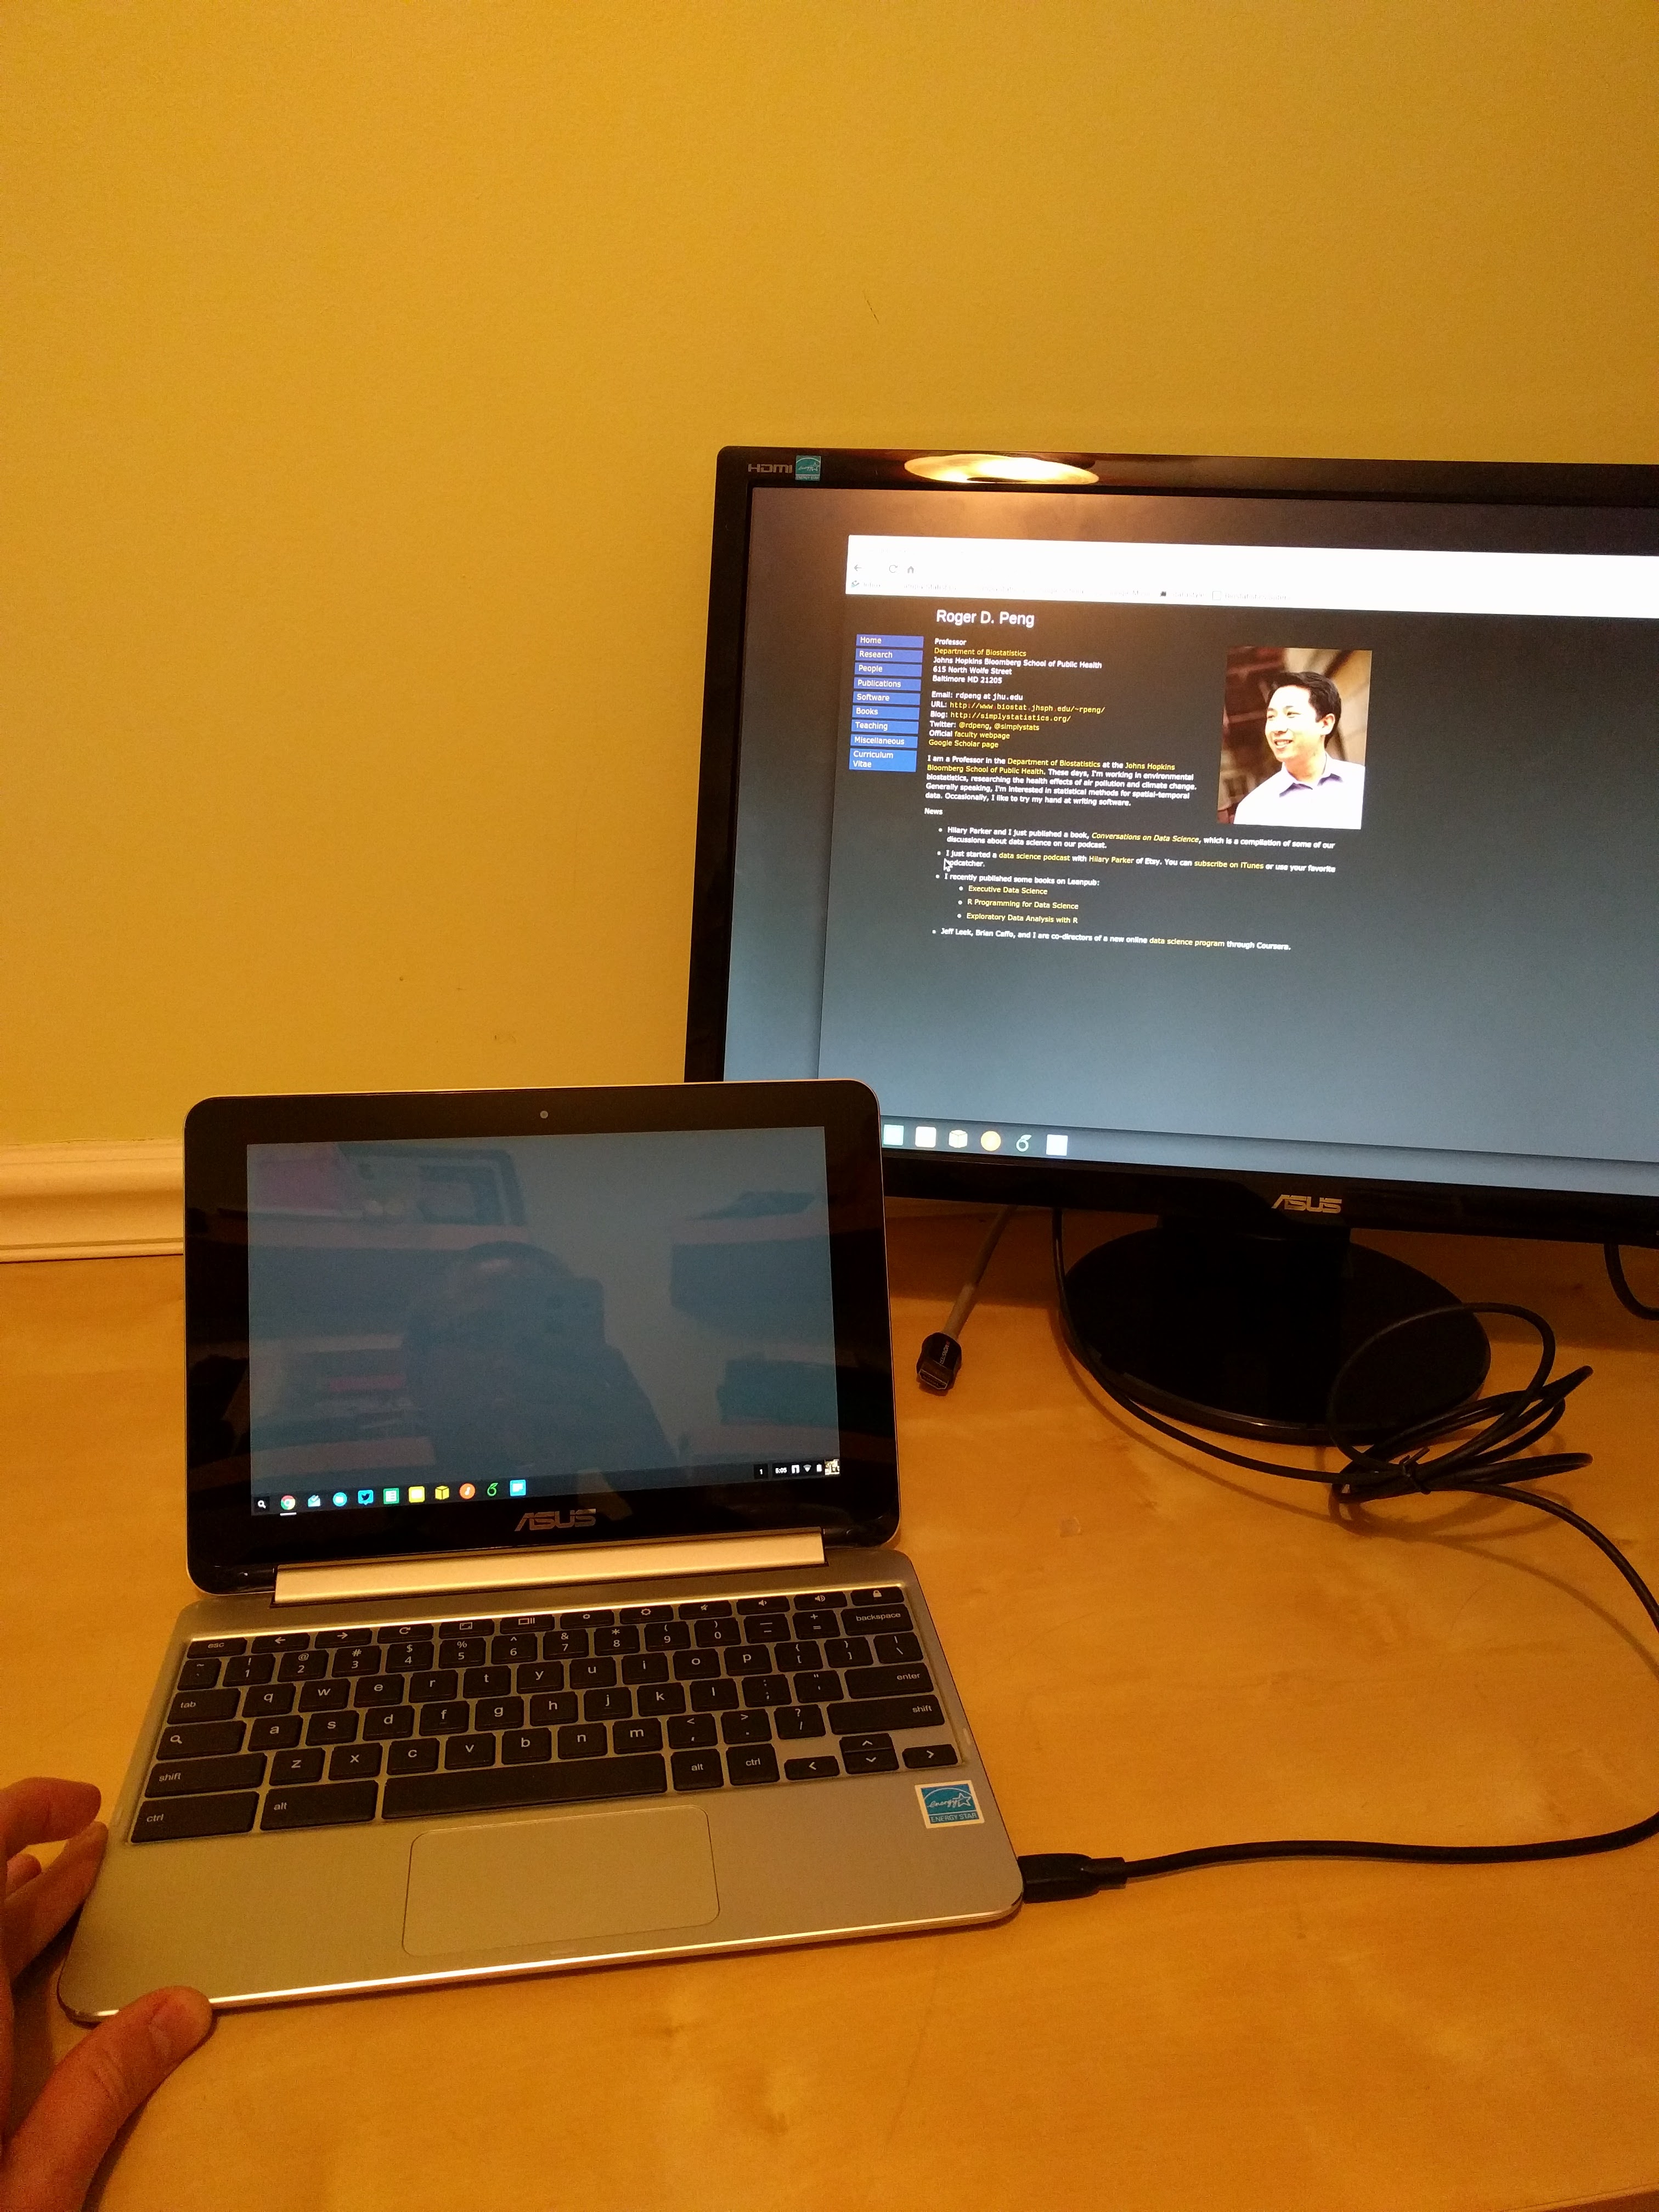
So to execute the experience I got a brand new ASUS chromebook flip and the connector I need to plug it into hdmi monitors (there is no escaping at least one dongle I guess :(). Here is what that badboy looks like in my home office with Apple superfanboy Roger on the screen.

In terms of software there have been some major improvements since I last tried this experiment out. Some of these I talk about in my book How to be a modern scientist. As of this writing this is my current setup:
That handles the vast majority of my workload so far (its only been a day :)). But I would welcome suggestions and I’ll report back when either I give up or if things are still going strong in a little while….
28 Oct 2016
Hilary and I go through the overflowing mailbag to respond to listener questions! Topics include causal inference in trend modeling, regression model selection, using SQL, and data science certification.
If you have questions you’d like us to answer, you can send them to
nssdeviations @ gmail.com or tweet us at @NSSDeviations.
Show notes:
Download the audio for this episode
Listen here:
26 Oct 2016
Josh Nussbaum has an interesting post over at Medium about whether massive datasets are the new server rooms of tech business.
The analogy comes from the “old days” where in order to start an Internet business, you had to buy racks and servers, rent server space, buy network bandwidth, license expensive server software, backups, and on and on. In order to do all that up front, it required a substantial amount of capital just to get off the ground. As inconvenient as this might have been, it provided an immediate barrier to entry for any other competitors who weren’t able to raise similar capital.
Of course,
…the emergence of open source software and cloud computing completely eviscerated the costs and barriers to starting a company, leading to deflationary economics where one or two people could start their company without the large upfront costs that were historically the hallmark of the VC industry.
So if startups don’t have huge capital costs in the beginning, what costs do they have? Well, for many new companies that rely on machine learning, they need to collect data.
As a startup collects the data necessary to feed their ML algorithms, the value the product/service provides improves, allowing them to access more customers/users that provide more data and so on and so forth.
Collecting huge datasets ultimately costs money. The sooner a startup can raise money to get that data, the sooner they can defend themselves from competitors who may not yet have collected the huge datasets for training their algorithms.
I’m not sure the analogy between datasets and server rooms quite works. Even back when you had to pay a lot of up front costs to setup servers and racks, a lot of that technology was already a commodity, and anyone could have access to it for a price.
I see massive datasets used to train machine learning algorithms as more like the new proprietary software. The startups of yore spent a lot of time writing custom software for what we might now consider mundane tasks. This was a time-consuming activity but the software that was developed had value and was a differentiator for the company. Today, many companies write complex machine learning algorithms, but those algorithms and their implmentations are quickly becoming commodities. So the only thing that separates one company from another is the amount and quality of data that they have to train those algorithms.
Going forward, it will be interesting see what these companies will do with those massive datasets once they no longer need them. Will they “open source” them and make them available to everyone? Could there be an open data movement analogous to the open source movement?
For the most part, I doubt it. While I think many today would perhaps sympathize with the sentiment that software shouldn’t have owners, those same people I think would argue vociferously that data most certainly do have owners. I’m not sure how I’d feel if Facebook made all their data available to anyone. That said, many datasets are made available by various businesses, and as these datasets grow in number and in usefulness, we may see a day where the collection of data is not a key barrier to entry, and that you can train your machine learning algorithm on whatever is out there.
20 Oct 2016
Editor’s note: This is a guest post by
Sean Kross. Sean is a software developer in the
Department of Biostatistics at the Johns Hopkins Bloomberg School of Public
Health. Sean has contributed to several of our specializations including
Data Science,
Executive Data Science,
and Mastering Software Development in R.
He tweets @seankross.
Over the past few months I’ve been helping Jeff develop the Advanced Data
Science class he’s teaching at the Johns Hopkins Bloomberg School of Public
Health. We’ve been trying to identify technologies that we can teach to
students which (we hope) will enable them to rapidly prototype data-based
software applications which will serve a purpose in public health. We started with
technologies that we’re familiar with (R, Shiny, static websites) but we’re
also trying to teach ourselves new technologies (the Amazon Alexa Skills API,
iOS and Swift). We’re teaching skills that we know intimately along with skills
that we’re learning on the fly which is a style of teaching that we’ve practiced
several
times.
Jeff and I have come to realize that while building new courses with
technologies that are new to us we experience particular pains and frustrations
which, when documented, become valuable learning resources for our students.
This process of documenting new-tech-induced pain is only a preliminary step.
When we actually launch classes either online or
in person our students run into new frustrations which we respond to with
changes to either documentation or course content. This process of quickly
iterating on course material is especially enhanced in online courses where the
time span for a course lasts a few weeks compared to a full semester, so kinks
in the course are ironed out at a faster rate compared to traditional in-person
courses. All of the material in our courses is open-source and available on
GitHub, and we teach our students how to use Git and GitHub. We can take
advantage of improvements and contributions the students think we should make
to our courses through pull requests that we recieve. Student contributions
further reduce the overall start-up pain experienced by other students.
With students from all over the world participating in our online courses we’re
unable to anticipate every technical need considering different locales,
languages, and operating systems. Instead of being anxious about this reality
we depend on a system of “distributed masochism” whereby documenting every
student’s unique technical learning pains is an important aspect of improving
the online learning experience. Since we only have a few months head start
using some of these technologies compared to our students it’s likely that as
instructors we’ve recently climbed a similar learning curve which makes it
easier for us to help our students. We believe that this approach of teaching
new technologies by allowing any student to contribute to open course material
allows a course to rapidly adapt to students’ needs and to the inevitable
changes and upgrades that are made to new technologies.
I’m extremely interested in communicating with anyone else who is using similar techniques, so if you’re interested please contact me via Twitter (@seankross) or send me an email: sean at seankross.com.


 Follow us on twitter