15 Dec 2016
Hilary and I talk about building data science products that provide a good user experience while adhering to some kind of ground truth, whether it’s in medicine, education, news, or elsewhere. Also Gilmore Girls.
If you have questions you’d like Hilary and me to answer, you can send them to nssdeviations @ gmail.com or tweet us at @NSSDeviations.
Show notes:
Download the audio for this episode
Listen here:
09 Dec 2016
When colleagues with young children seeking information about schools
ask me if I like the Massachusetts public school my
children attend, my answer is always the same: “it’s great…except for
math”. The fact is that in our household we supplement our kids’ math
education with significant extra curricular work in order to ensure
that they receive a math education comparable to what we received as
children in the public system.
The latest results from the Program for International Student
Assessment (PISA)
results
show that there is a general problem with math education in the
US. Were it a country, Massachusetts would have been in second place
in reading, sixth in science, but 20th in math, only ten points above
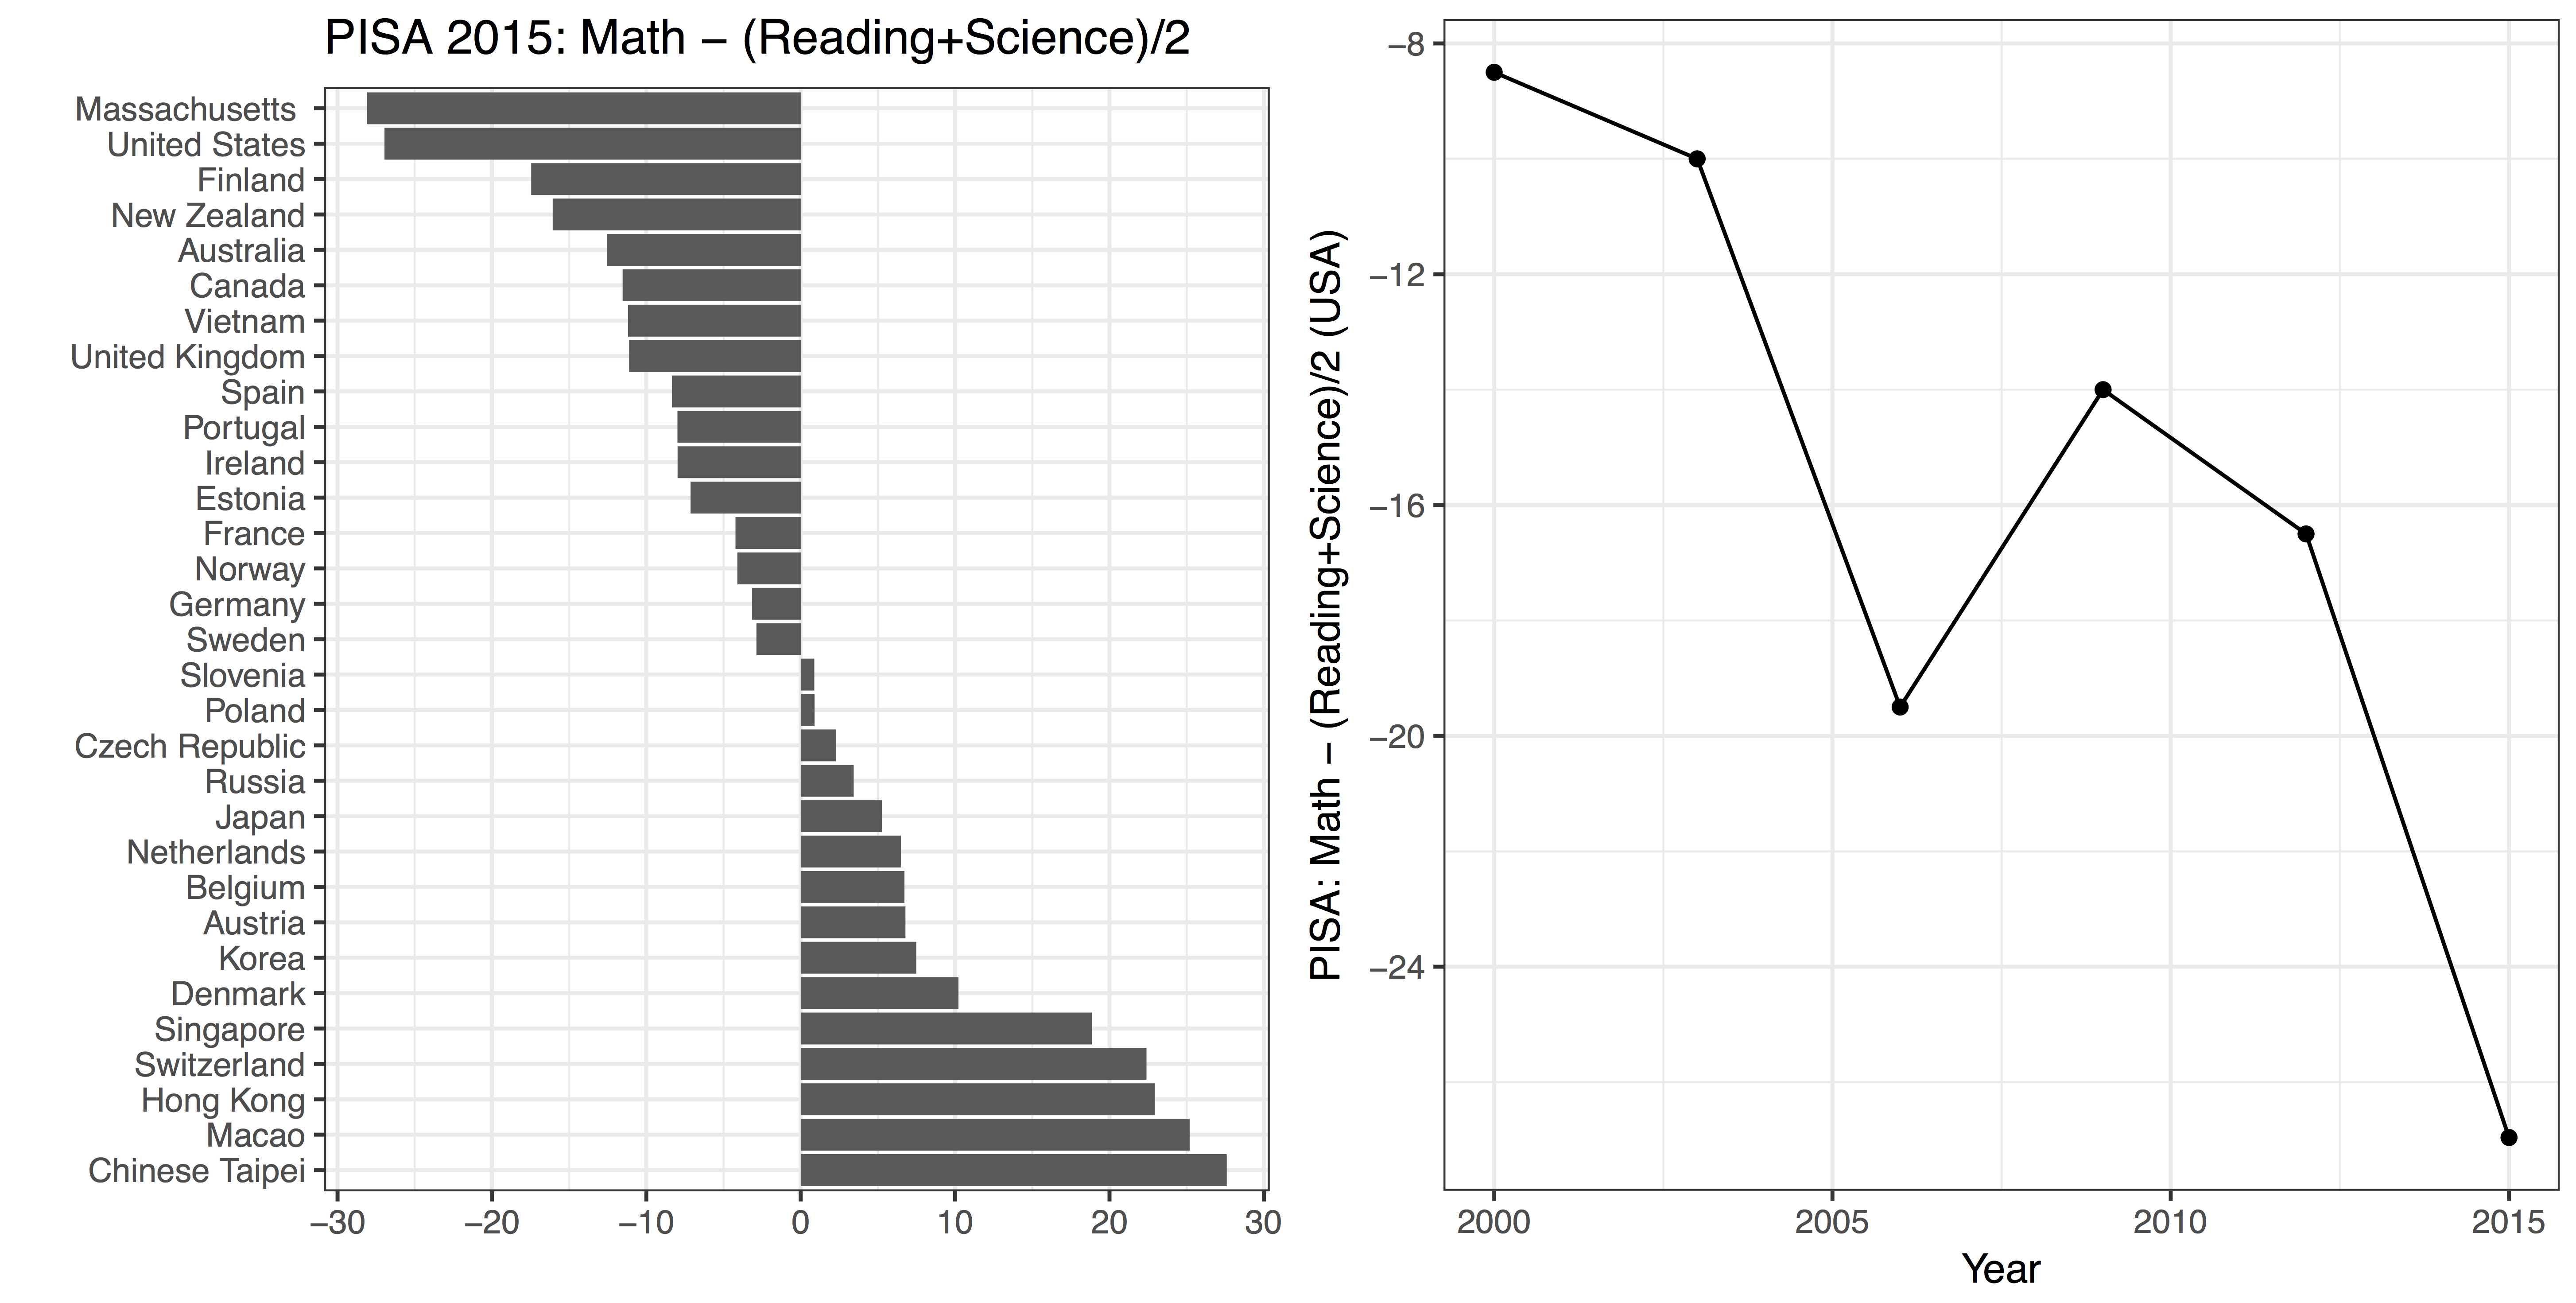
the OECD average of 490. The US as a whole did not fair nearly as well
as MA, and the same discrepancy between math and the other two
subjects was present. In fact, among the top 30 performing
countries ranked by their average of science and reading scores, the
US has, by far, the largest discrepancy between math and
the other two subjects tested by PISA. The difference of 27 was
substantially greater than the second largest difference,
which came from Finland at 17. Massachusetts had a difference of 28.

If we look at the trend of this difference since PISA was started 16
years ago, we see a disturbing progression. While science and reading
have
remained stable, math has declined. In
2000 the difference between the results in math and the other subjects
was only 8.5. Furthermore,
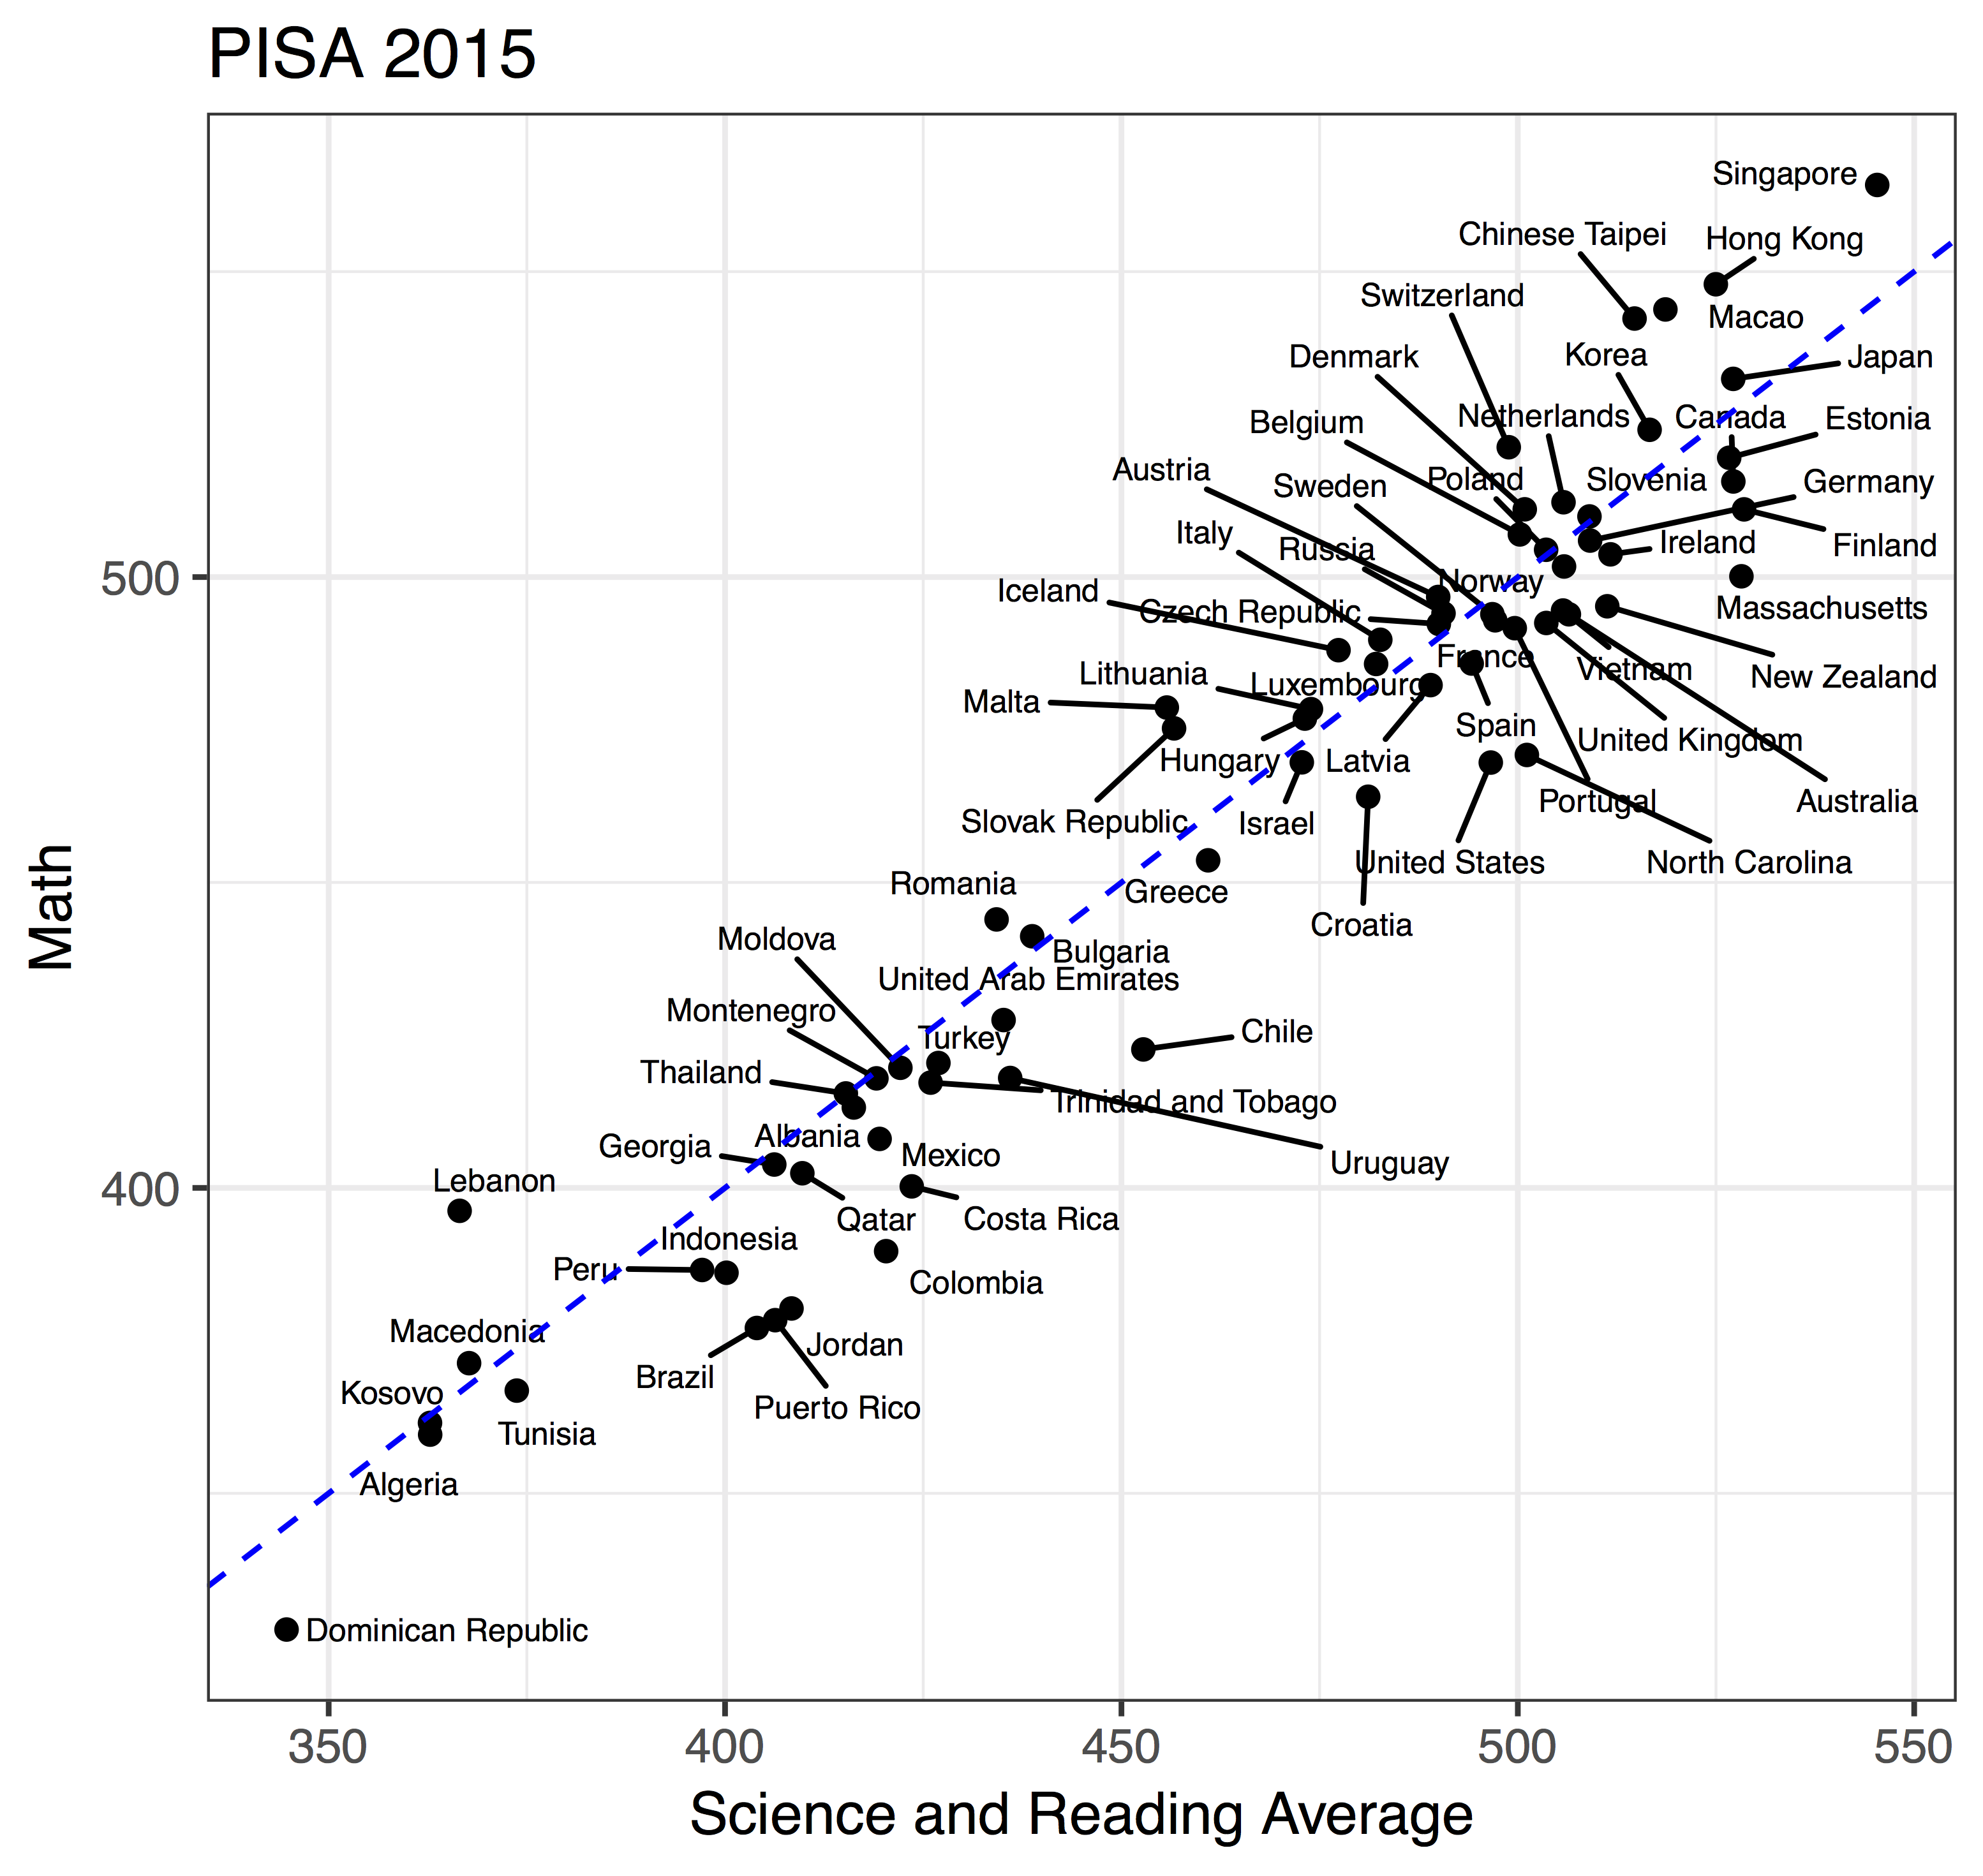
the US is not performing exceptionally well in any subject:

So what is going on? I’d love to read theories in the comment
section. From my experience comparing my kids’ public schools now
with those that I attended, I have one theory of my own. When I was a
kid there was a math textbook. Even when a teacher was bad, it
provided structure and an organized alternative for learning on your
own. Today this approach is seen as being “algorithmic” and has fallen
out of favor. “Project based learning” coupled with group activities have
become popular replacements.
Project based learning is great in principle. But, speaking from
experience, I can say it is very hard to come up with good projects,
even for highly trained mathematical minds. And it is certainly much
more time consuming for the instructor than following a
textbook. Teachers don’t have more time now than they did 30 years ago
so it is no surprise that this new more open approach leads to
improvisation and mediocre lessons. A recent example of a pointless
math project involved 5th graders picking a number and preparing a
colorful poster showing “interesting” facts about this number. To
make things worse in terms of math skills, students are often rewarded
for effort, while correctness is secondary and often disregarded.
Regardless of the reason for the decline, given the trends
we are seeing, we need to rethink the approach to math education. Math
education may have had its problems in the past, but recent evidence
suggests that the reforms of the past few decades seem to have
only worsened the situation.
Note: To make these plots I download and read-in the data into R as described here.
30 Nov 2016
I had the pleasure of sitting down with Amelia McNamara, Visiting Assistant Professor of Statistical and Data Sciences at Smith College, to talk about data science, data journalism, visualization, the problems with R, and adult coloring books.
If you have questions you’d like Hilary and me to answer, you can send them to nssdeviations @ gmail.com or tweet us at @NSSDeviations.
Show notes:
Download the audio for this episode
Listen here:
17 Nov 2016
My research group just recently finish a paper where several different teams within the group worked on different analyses. If you are interested the paper describes the recount resource which includes processed versions of thousands of human RNA-seq data sets.
As part of this project each group had to contribute some plots to the paper. One thing that I noticed is that each person used their own color palette and theme when building the plots. When we wrote the paper this made it a little harder for the figures to all fit together - especially when different group members worked on a single panel of a multi-panel plot.
So I started thinking about setting up a Leek group theme for both base R and ggplot2 graphics. One of the first problems was that every group member had their own opinion about what the best color palette would be. So we are running a little competition to determine what the official Leek group color palette for plots will be in the future.
As part of that process, one of my awesome postdocs, Shannon Ellis, decided to collect some data on how people perceive different color palettes. The survey is here:
https://docs.google.com/forms/d/e/1FAIpQLSfHMXVsl7pxYGarGowJpwgDSf9lA2DfWJjjEON1fhuCh6KkRg/viewform?c=0&w=1
If you have a few minutes and have an opinion about colors (I know you do!) please consider participating in our little poll and helping to determine the future of Leek group plots!
11 Nov 2016
Dear Lab Members,
I know that the results of Tuesday’s election have many of you
concerned about your future. You are not alone. I am concerned
about my future as well. But I want you to know that I have no plans
of going anywhere and I intend to dedicate as much time to our
projects as I always have. Meeting, discussing ideas and putting them
into practice with you is, by far, the best part of my job.
We are all concerned that if certain campaign promises are kept many
of our fellow citizens may need our help. If this happens, then we
will pause to do whatever we can to help. But I am currently
cautiously optimistic that we will be able to continue focusing on
helping society in the best way we know how: by doing scientific
research.
This week Dr. Francis Collins assured us that there is strong
bipartisan support for scientific research. As an example consider
this op-ed
in which Newt Gingrich advocates for doubling the NIH budget. There
also seems to be wide consensus in this country that scientific
research is highly beneficial to society and an understanding that to
do the best research we need the best of the best no matter their
gender, race, religion or country of origin. Nothing good comes from
creative, intelligent, dedicated people leaving science.
I know there is much uncertainty but, as of now, there is nothing stopping us
from continuing to work hard. My plan is to do just that and I hope
you join me.
 Follow us on twitter
