01 Dec 2011
If you’re interested in know what the air quality looks like in Beijing China, the US Embassy there has a particulate matter monitor on its roof that tweets the level of fine particulate matter (PM2.5) every hour (see @BeijingAir). In case you’re not used to staring at PM2.5 values all the time, let me provide some context.
The US National Ambient Air Quality Standard for the 24-hour average PM2.5 level is 35 mcg/m^3. The twitter feed shows hourly values, so you can’t compare it directly to the US NAAQS (you’d have to take the average of 24 values), but the levels are nevertheless pretty high.
For example, here’s the hourly time series plot of one 24-hour period in March of 2010:
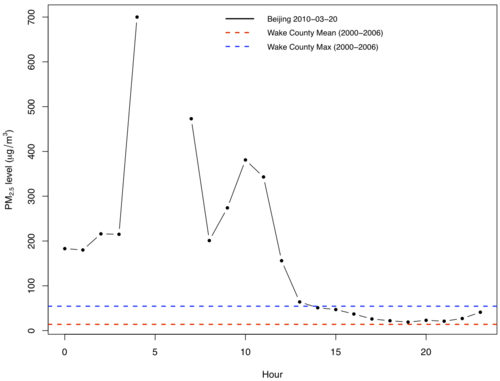
The red and blue lines show the average and maximum 24-hour value for Wake County, NC for the period 2000-2006 (I made this plot when I was giving a talk in Raleigh).
So, things could be worse here in the US, but remember that there’s no real evidence of a threshold for PM2.5, so even levels here are potentially harmful. But if you’re traveling to China anytime soon, might want to bring a respirator.
30 Nov 2011
A few weeks ago we learned that Warren Buffett is a big IBM fan (a $10 billion fan, that is). Having heard that I went over to the IBM web site to see what they’re doing these days. For starters, they’re not selling computers anymore! At least not the kind that I would use. One of the big things they do now is “Business Analytics and Optimization” (i.e. statistics), which is one of the reasons they bought SPSS and then later Algorithmics.
Roaming around the IBM web site, I found this little video on how IBM is involved with tennis matches like the US Open. It’s the usual promo video: a bit cheesy, but pretty interesting too. For example, they provide all the players an automatically generated post-game “match analysis DVD” that has summaries of all the data from their match with corresponding video.
It occurred to me that one of the challenges that a company like IBM faces is selling the “power of analytics” to other companies. They need to make these promo videos because, I guess, some companies are not convinced they need this whole analytics thing (or at least not from IBM). They probably need to do methods and software development too, but getting the deal in the first place is at least as important.
In contrast, here at Johns Hopkins, my experience has been that we don’t really need to sell the “power of statistics” to anyone. For the most part, researchers around here seem to be already “sold”. They understand that they are collecting a ton of data and they’re going to need statisticians to help them understand it. Maybe Hopkins is the exception, but I doubt it.
Good for us, I suppose, for now. But there is a danger that we take this kind of monopoly position for granted. Companies like IBM hire the same people we do (including one grad school classmate) and there’s no reason why they couldn’t become direct competitors. We need to continuously show that we can make sense of data in novel ways.
29 Nov 2011
One of the nice things about tracking the R subversion repository using git instead of subversion is you can do
git shortlog -s -n
which gives you
19855  ripley
  6302  maechler
  5299  hornik
  2263  pd
  1153  murdoch
   813  iacus
   716  luke
   661  jmc
   614  leisch
   472  ihaka
   403  murrell
   286  urbaneks
   284  rgentlem
   269  apache
   253  bates
   249  tlumley
   164  duncan
    92  r
    43  root
    40  paul
    40  falcon
    39  lyndon
    34  thomas
    33  deepayan
    26  martyn
    18  plummer
    15  (no author)
    14  guido
     3  ligges
     1  mike
These data are since 1997 so for Brian Ripley, that’s 3.6 commits per day for the last 15 years.
I think that number 1 position will be out of reach for a while.
By the way, I highly recommend to anyone tracking subversion repositories that they use git to do it. You get all of the advantages of git and there are essentially no downsides.
28 Nov 2011
Over the Thanksgiving recent break I naturally started thinking about reproducible research in between salting the turkey and making the turkey stock. Clearly, these things are all related.
I sometimes get the sense that many people see reproducibility as essentially binary. A published paper is either reproducible, as in you can compute every single last numerical result to within epsilon precision, or it’s not. My feeling is that there is a spectrum of reproducibility when it comes to published scientific findings. Some papers are more reproducible than others. And that’s where cooking comes in.
I do a bit of cooking and I am a shameless consumer of food blogs/web sites. There seems pretty solid agreement (and my own experience essentially confirms) that the more you can make yourself and not have to rely on other people doing the cooking, the better. For example, for Thanksgiving, you could theoretically buy yourself a pre-roasted turkey that’s ready to eat. My brother tells me this is what homesick Americans do in China because so few people have an oven (I suppose you could steam a turkey?). Or you could buy an un-cooked turkey that is “flavor injected”. Or you could buy a normal turkey and brine/salt it yourself. Or you could get yourself one of those heritage turkeys. Or you could raise your own turkeys…. I think in all of these cases, the turkey would definitely be edible and maybe even tasty. But some would probably be more tasty than others.
And that’s the point. There’s a spectrum when it comes to cooking and some methods result in better food than others. Similarly, when it comes to published research there is a spectrum of what authors can make available to reproduce their work. On the one hand, you have just the paper itself, which reveals quite a bit of information (i.e. the scientific question, the general approach) but usually too few details to actually reproduce (or even replicate) anything. Some authors might release the code, which allows you to study the algorithms and maybe apply them to your own work. Some might release the code and the data so that you can actually reproduce the published findings. Some might make a nice R package/vignette so that you barely have to lift a finger. Each case is better than the previous, but that’s not to say that I would only accept the last/best case. Some reproducibility is better than none.
That said, I don’t think we should shoot low. Ideally, we would have the best case, which would allow for full reproducibility and rapid dissemination of ideas. But while we wait for that best case scenario, it couldn’t hurt to have a few steps in between.
 Follow us on twitter