Meet the Skeptics: Why Some Doubt Biomedical Models - and What it Takes to Win Them Over
02 Jul 2012Meet the Skeptics: Why Some Doubt Biomedical Models - and What it Takes to Win Them Over
 Follow us on twitter @simplystats
Meet the Skeptics: Why Some Doubt Biomedical Models - and What it Takes to Win Them Over
Obamacare may help protect a vulnerable section of our population, but it does nothing to solve the real problem with health care in the US: it is unsustainably expensive and getting worst worse. In the graph below (left) per capita medical expenditures for several countries are plotted against time. The US is the black curve, other countries are in grey. On the right we see life expectancy plotted against per capita medical expenditure. Note that the US spends $8,000 per person on healthcare, more than any other country and about 40% more than Norway, the runner up. If the US spent the same as Norway per person, as a country we would save ~ 1 trillion $ per year. Despite the massive investment, life expectancy in the US is comparable to Chile’s, a country that spends about $1,500 per person. To make matters worse, politicians and pundits greatly oversimply this problem by trying to blame their favorite villains while experts agree: no obvious solution exists.

This past Tuesday Johns Hopkins announced the launching of the Individualized Health Initiative. This effort will be led by Scott Zeger, a statistician and former chair of our department. The graphs and analysis shown above are from a presentation Scott has shared on the web. The initiative’s goal is to “discover, test, and implement health information tools that allow the individual to understand, track, and guide his or her unique health state and its trajectory over time”. In other words, by tailoring treatments and prevention schemes for individuals we can improve their health more effectively.
1
49
284
Johns Hopkins University
2
1
332
14.0
96
800x600
So how is this going to help solve the health care crisis? Scott explains that when it comes to health care, Hopkins is a self-contained microcosm: we are the patients (all employees), the providers (hospital and health system), and the insurer (Hopkins is self-insured, we are not insured by for-profit companies). And just like the rest of the country, we spend way too much per person on health care. Now, because we are self-contained, it is much easier for us to try out and evaluate alternative strategies than it is for, say, a state or the federal government. Because we are large, we can gather enough data to learn about relatively small strata. And with a statistician in charge, we will evaluate strategies empirically as opposed to ideologically.
Furthermore, because we are a University, we also employ Economists, Public Health Specialists, Ethicists, Basic Biologists, Engineers, Biomedical Researchers, and other scientists with expertise that seem indispensable to solve this problem. Under Scott’s leadership, I expect Hopkins to collect data more systematically, run well thought-out experiments to test novel ideas, leverage technology to improve diagnostics, and use existing data to create knowledge. Successful strategies may then be exported to the rest of the country. Part of the new institute’s mission is to incentivize our very creative community of academics to participate in this endeavor.
It seems like half of the battle in statistics is identifying an important/unsolved problem. In math, this is easy, they have a list. So why is it harder for statistics? Since I have to think up projects to work on for my research group, for classes I teach, and for exams we give, I have spent some time thinking about ways that research problems in statistics arise.
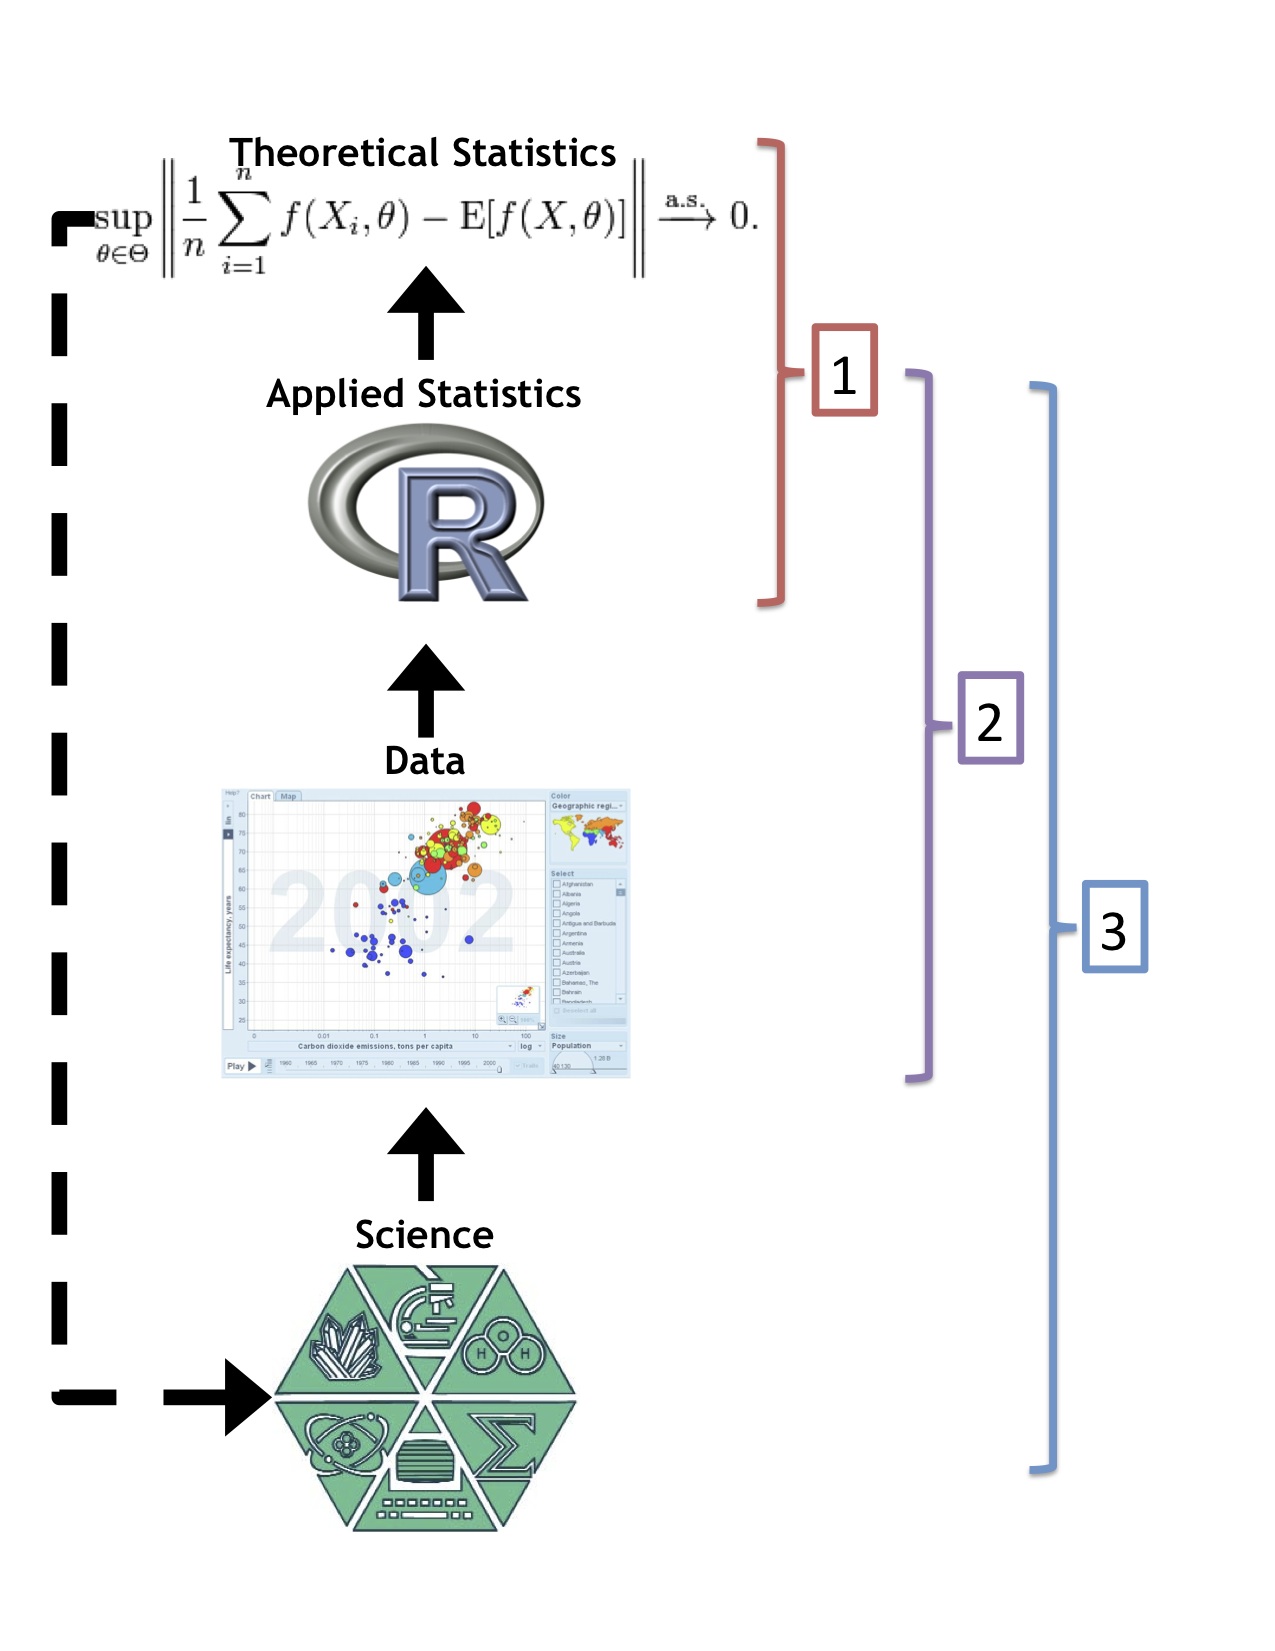
I borrowed a page out of Roger’s book and made a little diagram to illustrate my ideas (actually I can’t even claim credit, it was Roger’s idea to make the diagram). The diagram shows the rough relationship of science, data, applied statistics, and theoretical statistics. Science produces data (although there are other sources), the data are analyzed using applied statistical methods, and theoretical statistics concerns the math behind statistical methods. The dotted line indicates that theoretical statistics ostensibly generalizes applied statistical methods so they can be applied in other disciplines. I do think that this type of generalization is becoming harder and harder as theoretical statistics becomes farther and farther removed from the underlying science.
Based on this diagram I see three major sources for statistical problems:
So this leads back to the question, what are the biggest open problems in statistics? I would define these problems as the “high potential impact” problems from category 3. To answer this question, I think we need to ask ourselves, what are the most common problems people are trying to solve with data but can’t with what is available right now? Roger nailed this when he talked about the role of statisticians in the science club.
Here are a few ideas that could potentially turn into high-impact statistical problems, maybe our readers can think of better ones?
Thanks to John Cook for posting this:
“If you’re only skeptical, then no new ideas make it through to you. You never can learn anything. You become a crotchety misanthrope convinced that nonsense is ruling the world.” – Carl Sagan