26 Aug 2016
Jenny Bryan, developer of the google sheets R package, gave a talk at Use2015 about the package.
One of the things that got me most excited about the package was an example she gave in her talk of using the Google Sheets package for data collection at ultimate frisbee tournaments. One reason is that I used to play a little ultimate back in the day.
Another is that her idea is an amazing one for producing cool public health applications. One of the major issues with public health is being able to do distributed data collection cheaply, easily, and reproducibly. So I decided to write a little tutorial on how one could use Google Sheets and R to create a free distributed data collecton “app” for public health (or anything else really).
What you will need
The “app”
What we are going to do is collect data in a Google Sheet or sheets. This sheet can be edited by anyone with the link using their computer or a mobile phone. Then we will use the googlesheets package to pull the data into R and analyze it.
Making the Google Sheet work with googlesheets
After you have a first thing to do is to go to the Google Sheets I suggest bookmarking this page: https://docs.google.com/spreadsheets/u/0/ which skips the annoying splash screen.
Create a blank sheet and give it an appropriate title for whatever data you will be collecting.
Next, we need to make the sheet public on the web so that the googlesheets package can read it. This is different from the sharing settings you set with the big button on the right. To make the sheet public on the web, go to the “File” menu and select “Publish to the web…”. Like this:
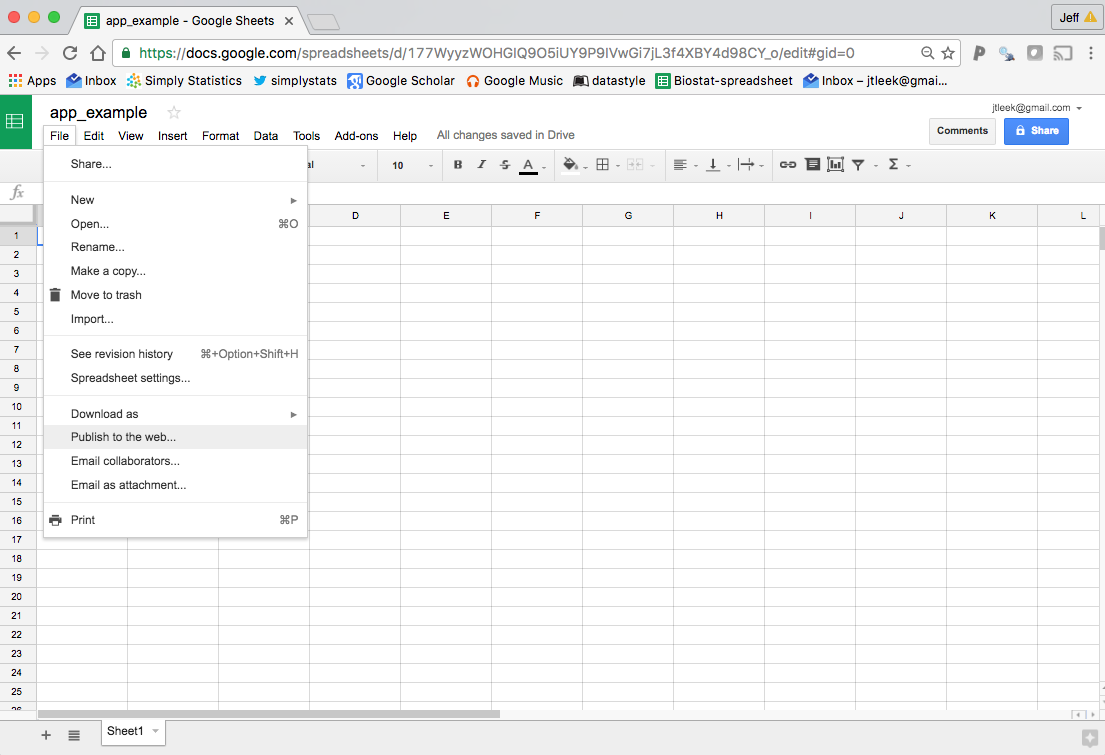
then it will ask you if you want to publish the sheet, just hit publish
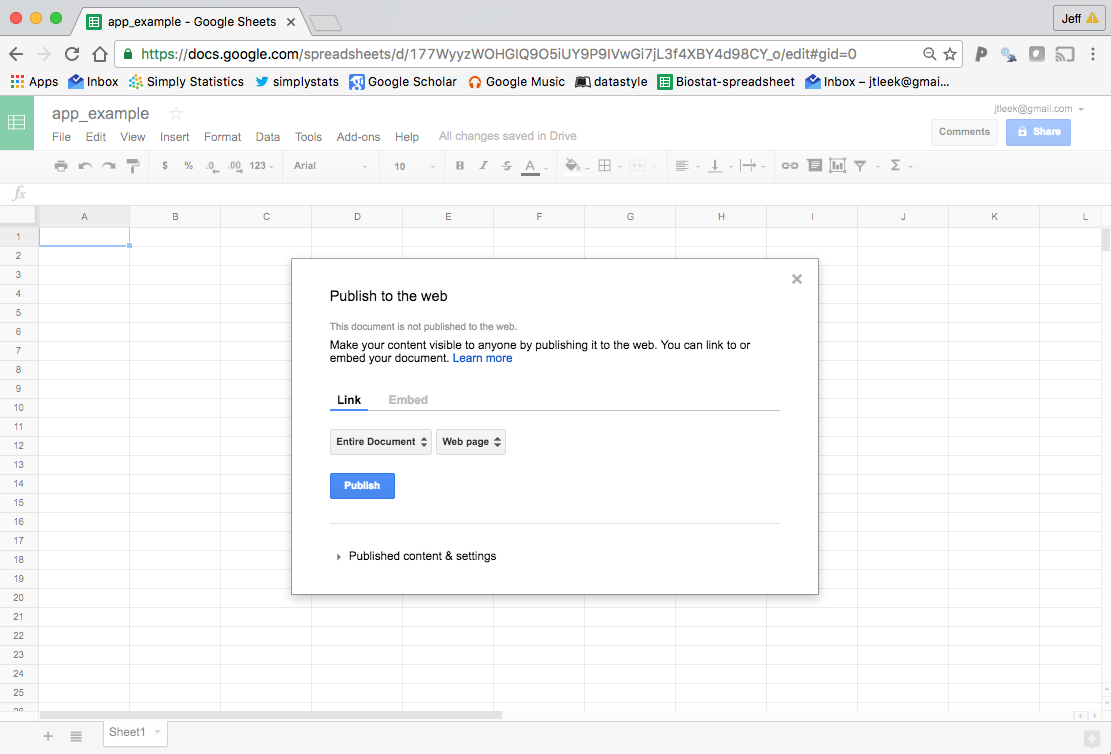
Copy the link it gives you and you can use it to read in the Google Sheet. If you want to see all the Google Sheets you can read in, you can load the package and use the gs_ls function.
library(googlesheets)
sheets = gs_ls()
sheets[1,]
## # A tibble: 1 x 10
##   sheet_title author  perm version             updated
##         <chr>  <chr> <chr>   <chr>              <time>
## 1 app_example jtleek    rw     new 2016-08-26 17:48:21
## # ... with 5 more variables: sheet_key <chr>, ws_feed <chr>,
## #   alternate <chr>, self <chr>, alt_key <chr>
It will pop up a dialog asking for you to authorize the googlesheets package to read from your Google Sheets account. Then you should see a list of spreadsheets you have created.
In my example I created a sheet called “app_example” so I can load the Google Sheet like this:
## Identifies the Google Sheet
example_sheet = gs_title("app_example")
## Sheet successfully identified: "app_example"
## Reads the data
dat = gs_read(example_sheet)
## Accessing worksheet titled 'Sheet1'.
## No encoding supplied: defaulting to UTF-8.
## # A tibble: 3 x 5
##   who_collected at_work person  time       date
##           <chr>   <chr>  <chr> <chr>      <chr>
## 1          jeff      no   ingo 13:47 08/26/2016
## 2          jeff     yes  roger 13:47 08/26/2016
## 3          jeff     yes  brian 13:47 08/26/2016
In this case the data I’m collecting is about who is at work right now as I’m writing this post :). But you could collect whatever you want.
Distributing the data collection
Now that you have the data published to the web, you can read it into Google Sheets. Also, anyone with the link will be able to view the Google Sheet. But if you don’t change the sharing settings, you are the only one who can edit the sheet.
This is where you can make your data collection distributed if you want. If you go to the “Share” button, then click on advanced you will get a screen like this and have some options.
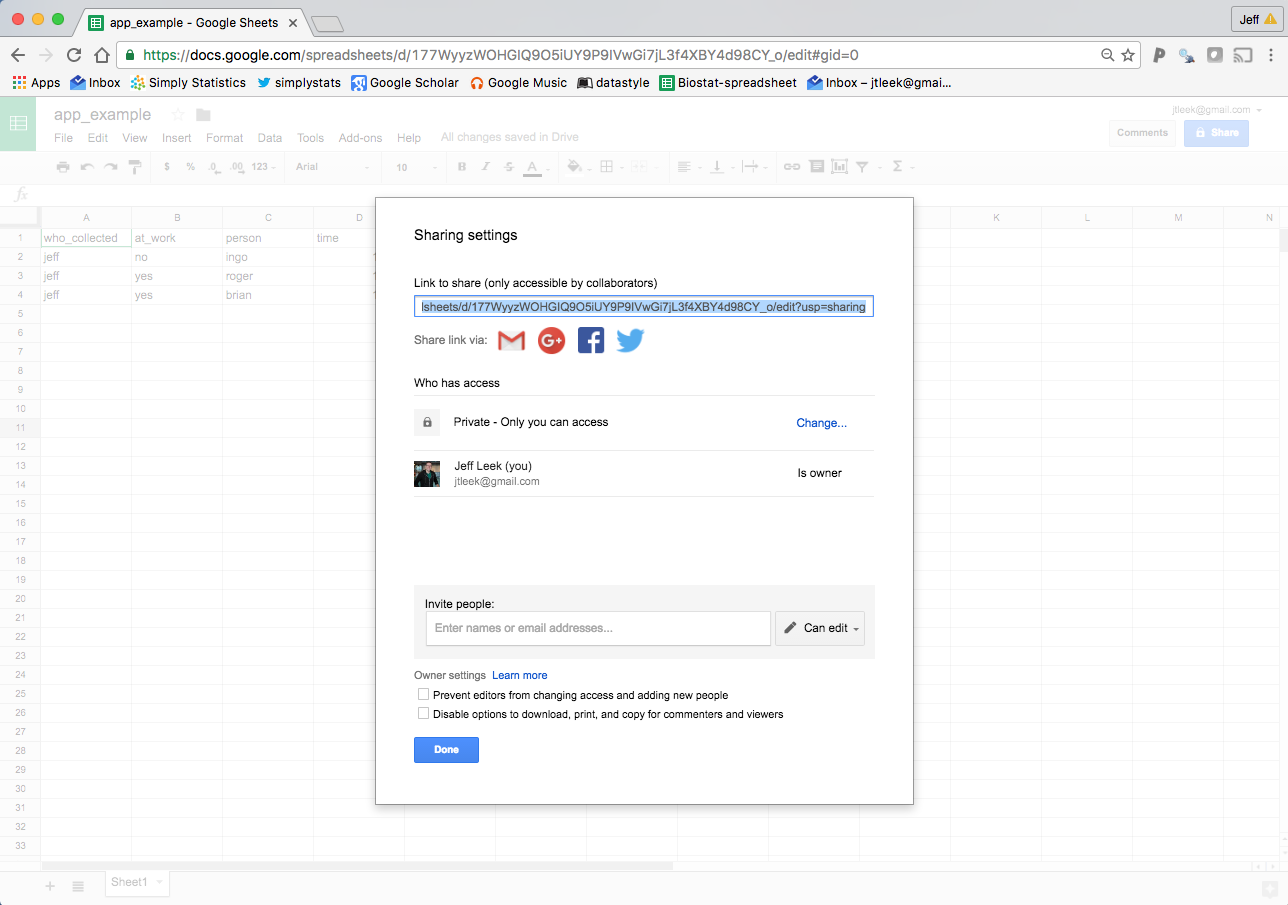
Private data collection
In the example I’m using I haven’t changed the sharing settings, so while you can see the sheet, you can’t edit it. This is nice if you want to collect some data and allow other people to read it, but you don’t want them to edit it.
Controlled distributed data collection
If you just enter people’s emails then you can open the data collection to just those individuals you have shared the sheet with. Be careful though, if they don’t have Google email addresses, then they get a link which they could share with other people and this could lead to open data collection.
Uncontrolled distributed data collection
Another option is to click on “Change” next to “Private - Only you can access”. If you click on “On - Anyone with the link” and click on “Can View”.
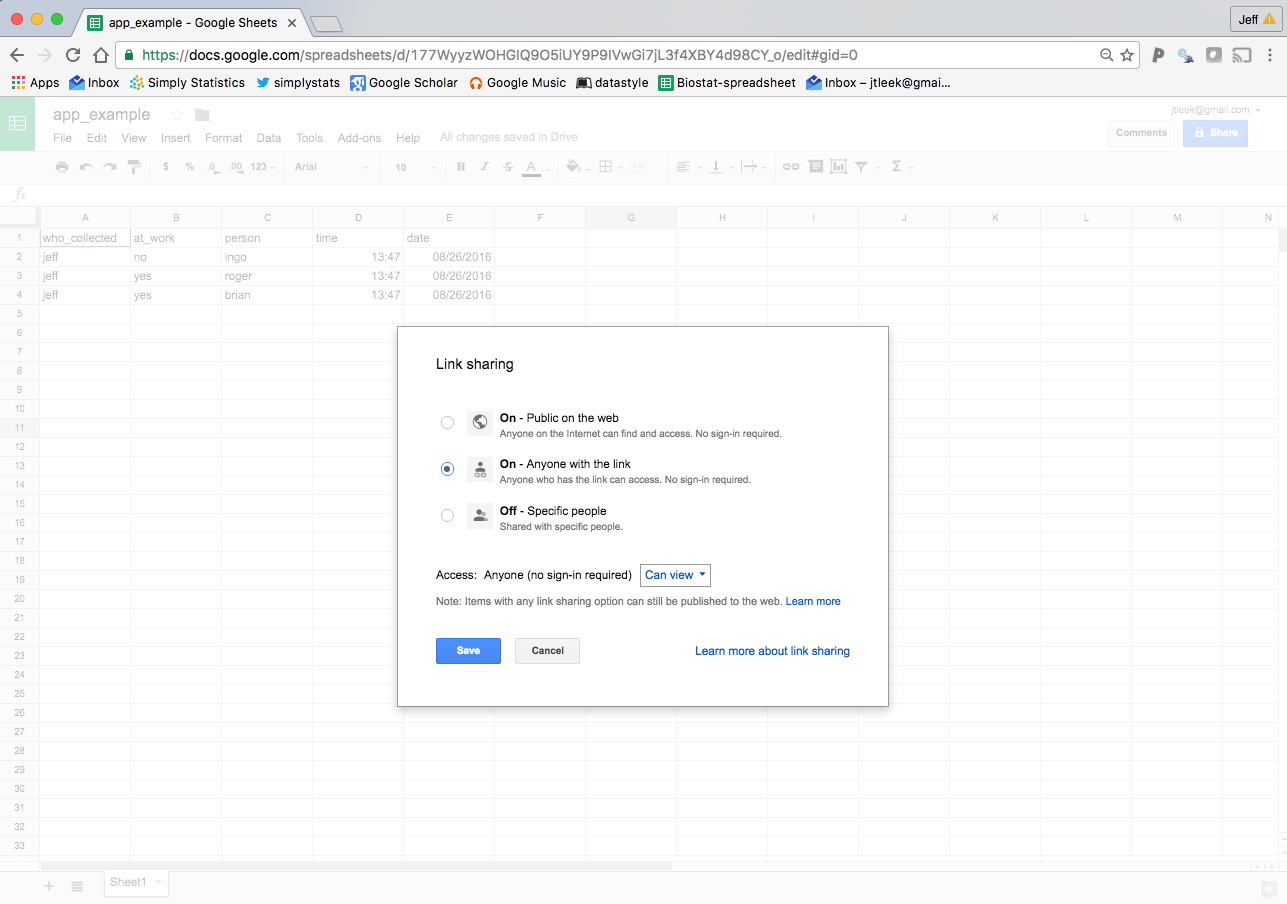
Then you can modify it to say “Can Edit” and hit “Save”. Now anyone who has the link can edit the Google Sheet. This means that you can’t control who will be editing it (careful!) but you can really widely distribute the data collection.
Collecting data
Once you have distributed the link either to your collaborators or more widely it is time to collect data. This is where I think that the “app” part of this is so cool. You can edit the Google Sheet from a Desktop computer, but if you have the (free!) Google Sheets app for your phone then you can also edit the data on the go. There is even an offline mode if the internet connection isn’t available where you are working (more on this below).
Quality control
One of the major issues with distributed data collection is quality control. If possible you want people to input data using (a) a controlled vocubulary/system and (b) the same controlled vocabulary/system. My suggestion here depends on whether you are using a controlled distributed system or an uncontrolled distributed system.
For the controlled distributed system you are specifically giving access to individual people - you can provide some training or a walk through before giving them access.
For the uncontrolled distributed system you should create a very detailed set of instructions. For example, for my sheet I would create a set of instructions like:
- Every data point must have a label of who collected in in the
who_collected column. You should pick a username that does not currently appear in the sheet and stick with it. Use all lower case for your username.
- You should either report “yes” or “no” in lowercase in the
at_work column.
- You should report the name of the person in all lower case in the
person column. You should search and make sure that the person you are reporting on doesn’t appear before introducing a new name. If the name already exists, use the name spelled exactly as it is in the sheet already.
- You should report the
time in the format hh:mm on a 24 hour clock in the eastern time zone of the United States.
- You should report the
date in the mm/dd/yyyy format.
You could be much more detailed depending on the case.
Offline editing and conflicts
One of the cool things about Google Sheets is that they can even be edited without an internet connection. This is particularly useful if you are collecting data in places where internet connections may be spotty. But that may generate conflicts if you use only one sheet.
There may be different ways to handle this, but one I thought of is to just create one sheet for each person collecting data (if you are using controlled distributed data collection). Then each person only edits the data in their sheet, avoiding potential conflicts if multiple people are editing offline and non-synchronously.
Reading the data
Anyone with the link can now read the most up-to-date data with the following simple code.
## Identifies the Google Sheet
example_sheet = gs_url("https://docs.google.com/spreadsheets/d/177WyyzWOHGIQ9O5iUY9P9IVwGi7jL3f4XBY4d98CY_o/pubhtml")
## Sheet-identifying info appears to be a browser URL.
## googlesheets will attempt to extract sheet key from the URL.
## Putative key: 177WyyzWOHGIQ9O5iUY9P9IVwGi7jL3f4XBY4d98CY_o
## Sheet successfully identified: "app_example"
## Reads the data
dat = gs_read(example_sheet, ws="Sheet1")
## Accessing worksheet titled 'Sheet1'.
## No encoding supplied: defaulting to UTF-8.
## # A tibble: 3 x 5
##   who_collected at_work person  time       date
##           <chr>   <chr>  <chr> <chr>      <chr>
## 1          jeff      no   ingo 13:47 08/26/2016
## 2          jeff     yes  roger 13:47 08/26/2016
## 3          jeff     yes  brian 13:47 08/26/2016
Here the url is the one I got when I went to the “File” menu and clicked on “Publish to the web…”. The argument ws in the gs_read command is the name of the worksheet. If you have multiple sheets assigned to different people, you can read them in one at a time and then merge them together.
Conclusion
So that’s it, its pretty simple. But as I gear up to teach advanced data science here at Hopkins I’m thinking a lot about Sean Taylor’s awesome post Real scientists make their own data
I think this approach is a super cool/super lightweight system for collecting data either on your own or as a team. As I said I think it could be really useful in public health, but it could also be used for any data collection you want.
24 Aug 2016
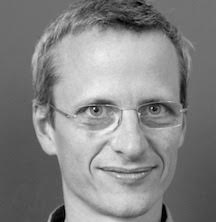
Editor’s Note: We are again pleased to interview the COPSS President’s award winner. The COPSS Award is one of the most prestigious in statistics, sometimes called the Nobel Prize in statistics. This year the award went to Nicolai Meinshausen from ETH Zurich. He is known for his work in causality, high-dimensional statistics, and machine learning. Also see our past COPSS award interviews with John Storey and Martin Wainwright.
Do you consider yourself to be a statistician, data scientist, machine learner, or something else?
Perhaps all of the above. If you forced me to pick one, then statistician but I hope we will soon come to a point where these distinctions do not matter much any more.
How did you find out you had won the COPSS award?
Jeremy Taylor called me. I know I am expected to say I did not expect it but that was indeed the case and it was a genuine surprise.
How do you see the fields of causal inference and high-dimensional statistics merging?
Causal inference is already very challenging in the low-dimensional case - if understood as data for which the number of observations exceeds
the number of variables. There are commonalities between high-dimensional statistics and the subfield of causal discovery, however, as we try to recover a sparse underlying structure from data in both cases
(say when trying to reconstruct a gene network from
observational and intervention data). The interpretations are just slightly different. A further difference is the implicit optimization. High-dimensional estimators can often be framed as convex optimization problems and the question is whether causal discovery can or should be
pushed in this direction as well.
Can you explain a little about how you can infer causal effects from inhomogeneous data?
Why do we want a causal model in the first place? In most cases the benefit of a causal over a regression model
is that the predictions of a causal model continue to be valid even if we intervene on the variables we use for prediction.
The inference we proposed turns this around and is looking for all models that are invariant in the sense that they give the same prediction accuracy across a number of different settings or environments. If we just have observational data, then this invariance
holds for all models but if the data are inhomogeneous, certain models can be discarded since they work better in one environment than in another and can thus not be causal. If all models that show invariance use a certain variable, we can claim that the variable in question
has a causal effect (while controlling type I error rates) and construct confidence intervals for the strength of the effect.
You have worked on studying the effects of climate change - do you think statisticians can play an important role in this debate?
To a certain extent. I have worked on several projects with physicists and the general caveat is that physicists are in general quite advanced in their methodology already and have quite a good understanding of the relevant statistical concepts. Biology is thus maybe a field where even more external input is required. Then again, it saves one from having to calculate t-tests in collaborations with physicists and just the interestingand challenging problems are left.
What advice would you give young statisticians getting into the discipline right now?
First I would say that they have made a good choice since these are interesting times for the field with many challenging and relevant problems still open and unsolved (but not completely out of reach either).
I think its important to keep an open mind and read as much literature as possible from neighbouring fields. My personal experience has been that it is very beneficial to get involved in some scientific collaborations.
What sorts of things is your group working on these days?
Two general themes: the first is what people would call more classical machine learning. For example, how can we detect interactions in large-scale datasets in sub-quadratic time? Secondly, we are trying to extend the invariance approach to causal inference
to more general settings, for example allowing for nonlinearities and hidden variables while at the same time
improving the computational aspects.
24 Aug 2016
By now, you’ve probably heard of the replication crisis in science. In summary, many conclusions from experiments done in a variety of fields have been found to not hold water when followed up in subsequent experiments. There are now any number of famous examples now, particularly from the fields of psychology and clinical medicine that show that the rate of replication of findings is less than the the expected rate.
The reasons proposed for this crisis are wide ranging, but typical center on the preference for “novel” findings in science and the pressure on investigators (especially new ones) to “publish or perish”. My favorite reason places the blame for the entire crisis on p-values.
I think to develop a better understanding of why there is a “crisis”, we need to step back and look across differend fields of study. There is one key question you should be asking yourself: Is the replication crisis evenly distributed across different scientific disciplines? My reading of the literature would suggest “no”, but the reasons attributed to the replication crisis are common to all scientists in every field (i.e. novel findings, publishing, etc.). So why would there be any heterogeneity?
An Aside on Replication and Reproducibility
As Lorena Barba recently pointed out, there can be tremendous confusion over the use of the words replication and reproducibility, so it’s best that we sort that out now. Here’s how I use both words:
-
replication: This is the act of repeating an entire study, independently of the original investigator without the use of original data (but generally using the same methods).
-
reproducibility: A study is reproducible if you can take the original data and the computer code used to analyze the data and reproduce all of the numerical findings from the study. This may initially sound like a trivial task but experience has shown that it’s not always easy to achieve this seemly minimal standard.
For more precise definitions of what I mean by these terms, you can take a look at my recent paper with Jeff Leek and Prasad Patil.
One key distinction between replication and reproducibility is that with replication, there is no need to trust any of the original findings. In fact, you may be attempting to replicate a study because you do not trust the findings of the original study. A recent example includes the creation of stem cells from ordinary cells, a finding that was so extraodinary that it led several laboratories to quickly try to replicate the study. Ultimately, seven separate laboratories could not replicate the finding and the original study was ultimately retracted.
Astronomy and Epidemiology
What do the fields of astronomy and epidemiology have in common? You might think nothing. Those two departments are often not even on the same campus at most universities! However, they have at least one common element, which is that the things that they study are generally reluctant to be controlled by human beings. As a result, both astronomers and epidemiologist rely heavily on one tools: the observational study.
Much has been written about observational studies of late, and I’ll spare you the literature search by saying that the bottom line is they can’t be trusted (particularly observational studies that have not been pre-registered!).
But that’s fine—we have a method for dealing with things we don’t trust: It’s called replication. Epidemiologists actually codified their understanding of when they believe a causal claim (see Hill’s Criteria), which is typically only after a claim has been replicated in numerous studies in a variety of settings. My understanding is that astronomers have a similar mentality as well—no single study will result in anyone believe something new about the universe. Rather, findings need to be replicated using different approaches, instruments, etc.
The key point here is that in both astronomy and epidemiology expectations are low with respect to individual studies. It’s difficult to have a replication crisis when nobody believes the findings in the first place. Investigators have a culture of distrusting individual one-off findings until they have been replicated numerous times. In my own area of research, the idea that ambient air pollution causes health problems was difficult to believe for decades, until we started seeing the same associations appear in numerous studies conducted all around the world. It’s hard to imagine any single study “proving” that connection, no matter how well it was conducted.
Theory and Experimentation in Science
I’ve already described the primary mode of investigation in astronomy and epidemiology, but there are of course other methods in other fields. One large category of methods includes the controlled experiment. Controlled experiments come in a variety of forms, whether they are laboratory experiments on cells or randomized clinical trials with humans, all of them involve intentional manipulation of some factor by the investigator in order to observe how such manipulation affects an outcome. In clinical medicine and the social sciences, controlled experiments are considered the “gold standard” of evidence. Meta-analyses and literature summaries generally weight publications with controlled experiments more highly than other approaches like observational studies.
The other aspect I want to look at here is whether a field has a strong basic theoretical foundation. The idea here is that some fields, like say physics, have a strong set of basic theories whose predictions have been consistently validated over time. Other fields, like medicine, lack even the most rudimentary theories that can be used to make basic predictions. Granted, the distinction between fields with or without “basic theory” is a bit arbitrary on my part, but I think it’s fair to say that different fields of study fall on a spectrum in terms of how much basic theory they can rely on.
Given the theoretical nature of different fields and the primary mode of investigation, we can develop the following crude 2x2 table, in which I’ve inserted some representative fields of study.
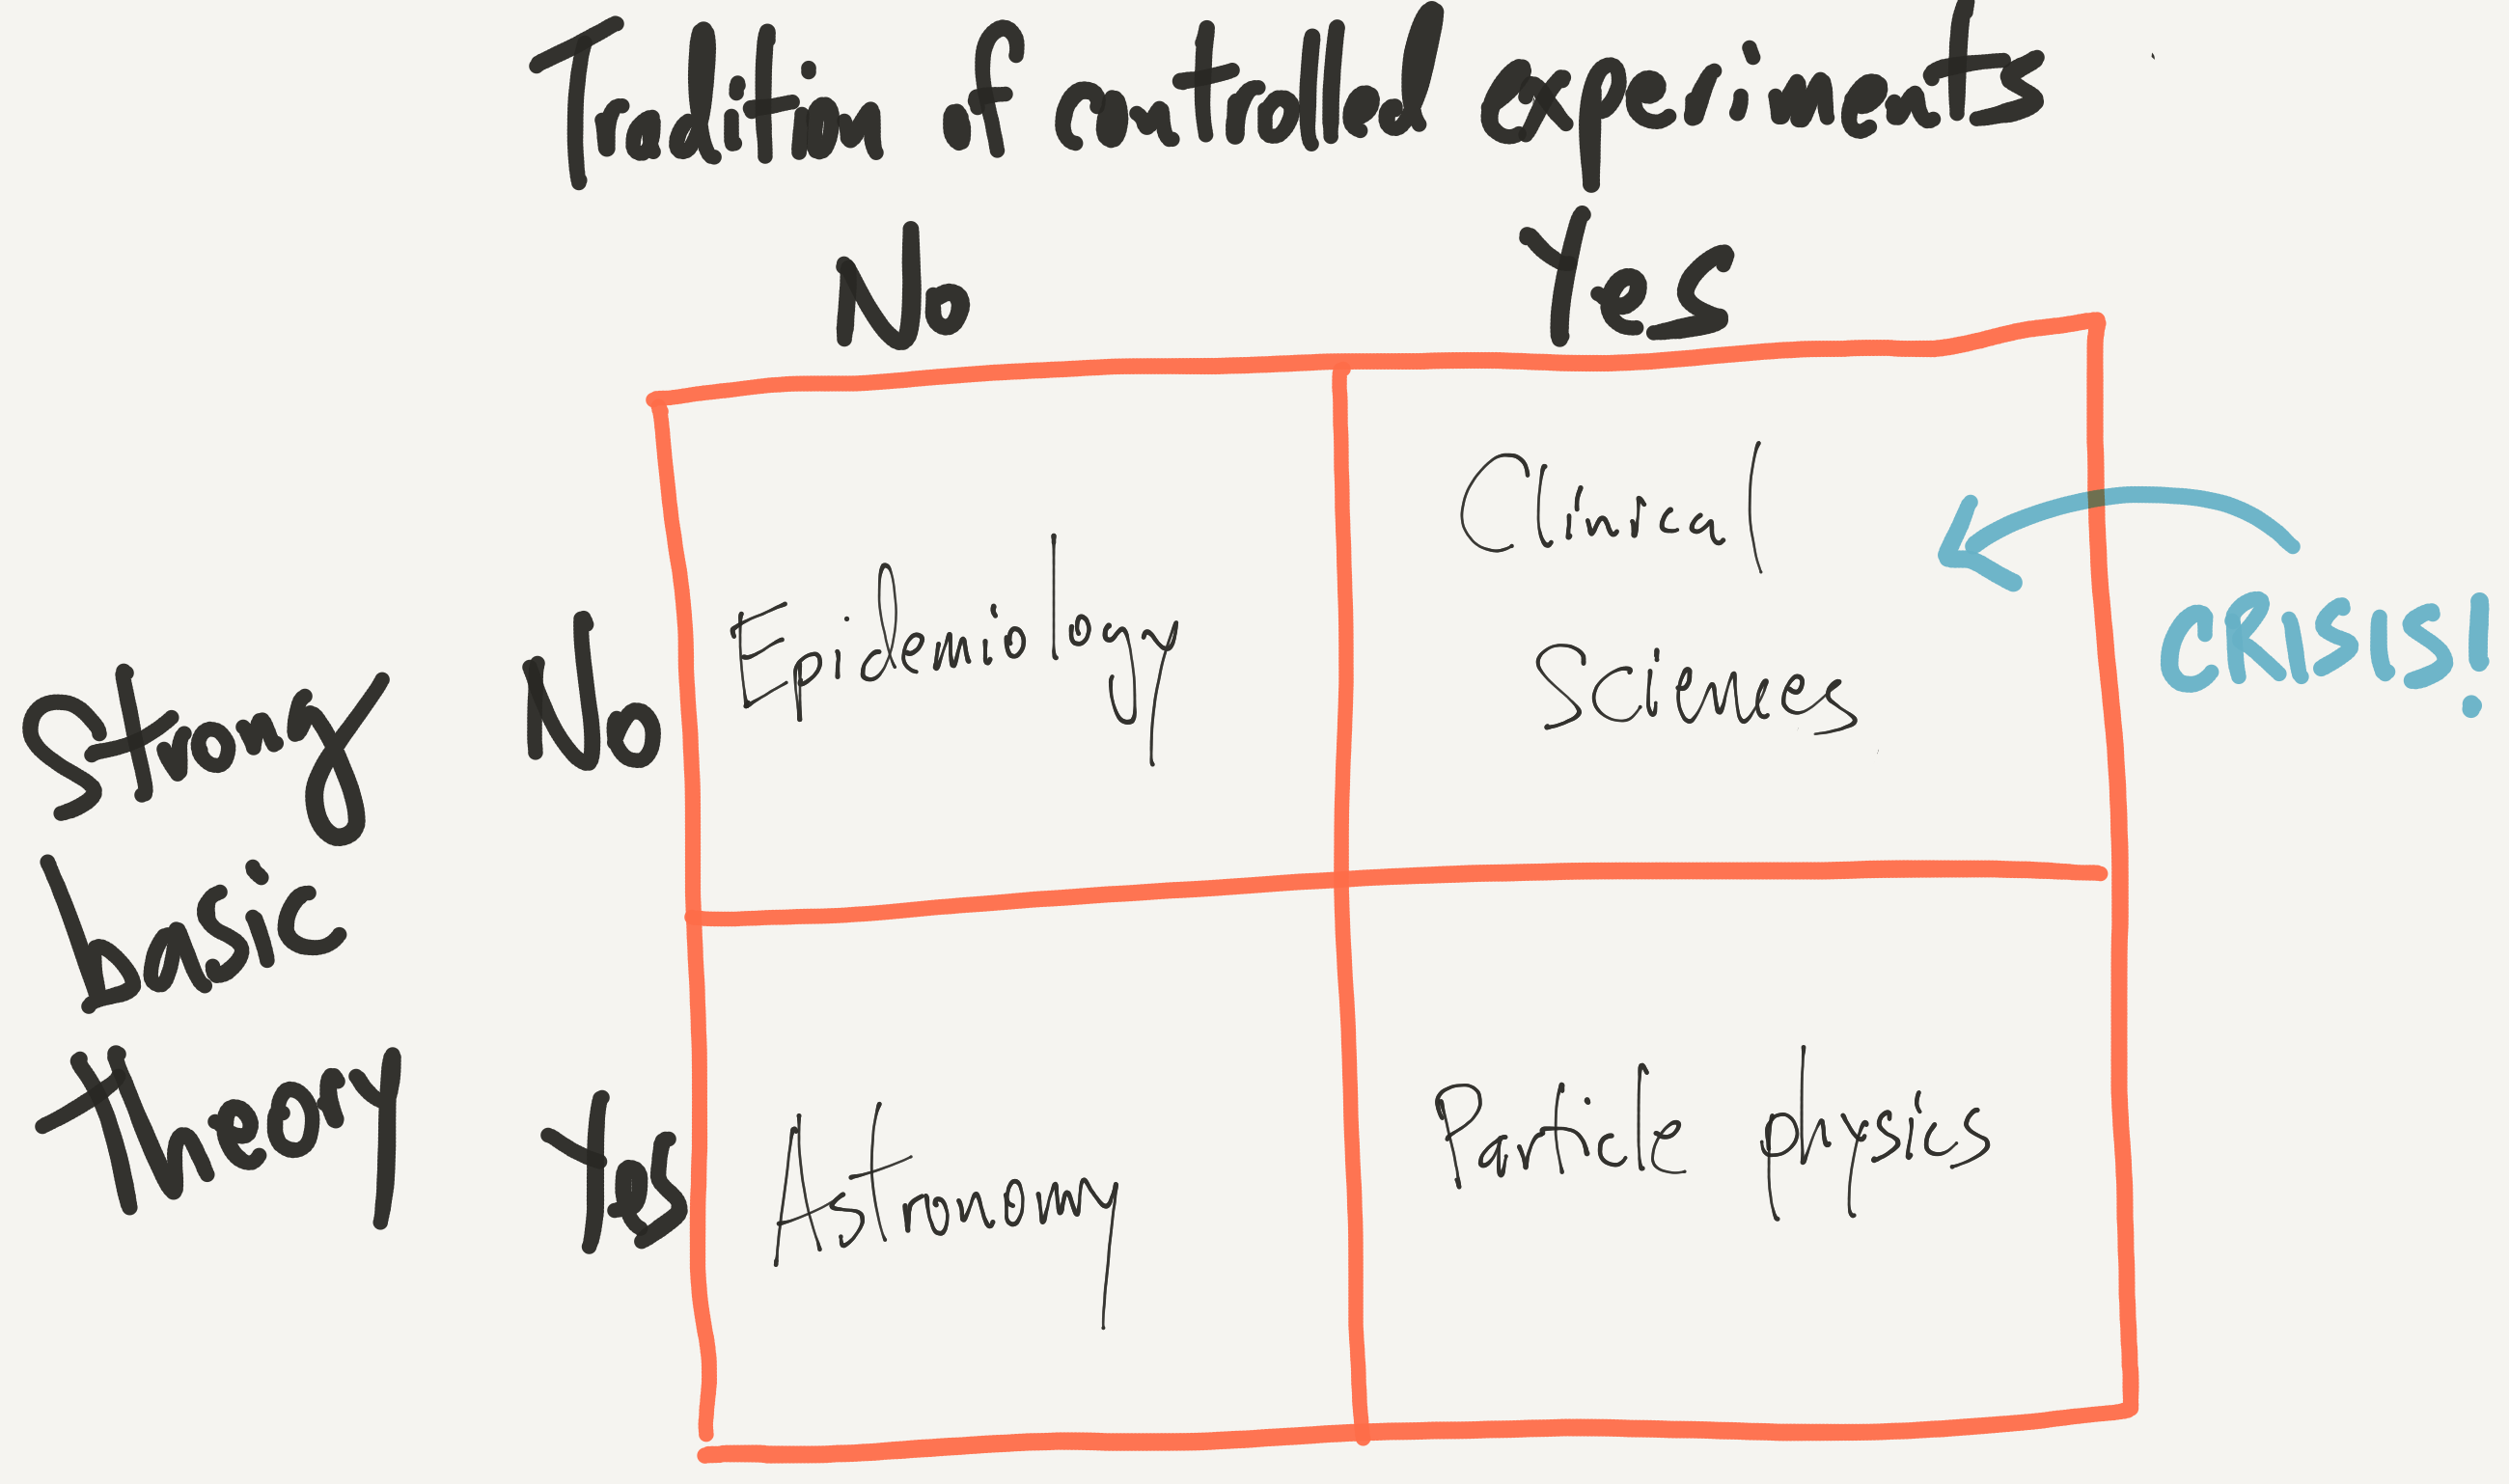
My primary contention here is
The replication crisis in science is concentrated in areas where (1) there is a tradition of controlled experimentation and (2) there is relatively little basic theory underpinning the field.
Further, in general, I don’t believe that there’s anything wrong with the people tirelessly working in the upper right box. At least, I don’t think there’s anything more wrong with them compared to the good people working in the other three boxes.
In case anyone is wondering where the state of clinical science is relative to, say, particle physics with respect to basic theory, I only point you to the web site for the National Center for Complementary and Integrative Health. This is essentially a government agency with a budget of $124 million dedicated to advancing pseudoscience. This is the state of “basic theory” in clinical medicine.
The Bottom Line
The people working in the upper right box have an uphill battle for at least two reasons
- The lack of strong basic theory makes it more difficult to guide investigation, leading to wider ranging efforts that may be less likely to replicate.
- The tradition of controlled experimentation places high expectations that research produced here is “valid”. I mean, hey, they’re using the gold standard of evidence, right?
The confluence of these two factors leads to a much greater disappointment when findings from these fields do not replicate. This leads me to believe that the replication crisis in science is largely attributable to a mismatch in our expectations of how often findings should replicate and how difficult it is to actually discover true findings in certain fields. Further, the reliance of controlled experiements in certain fields has lulled us into believing that we can place tremendous weight on a small number of studies. Ultimately, when someone asks, “Why haven’t we cured cancer yet?” the answer is “Because it’s hard”.
The Silver Lining
It’s important to remember that, as my colleague Rafa Irizarry pointed out, findings from many of the fields in the upper right box, especially clinical medicine, can have tremendous positive impacts on our lives when they do work out. Rafa says
…I argue that the rate of discoveries is higher in biomedical research than in physics. But, to achieve this higher true positive rate, biomedical research has to tolerate a higher false positive rate.
It is certainly possible to reduce the rate of false positives—one way would be to do no experiments at all! But is that what we want? Would that most benefit us as a society?
The Takeaway
What to do? Here are a few thoughts:
- We need to stop thinking that any single study is definitive or confirmatory, no matter if it was a controlled experiment or not. Science is always a cumulative business, and the value of a given study should be understood in the context of what came before it.
- We have to recognize that some areas are more difficult to study and are less mature than other areas because of the lack of basic theory to guide us.
- We need to think about what the tradeoffs are for discovering many things that may not pan out relative to discovering only a few things. What are we willing to accept in a given field? This is a discussion that I’ve not seen much of.
- As Rafa pointed out in his article, we can definitely focus on things that make science better for everyone (better methods, rigorous designs, etc.).
30 Jul 2016
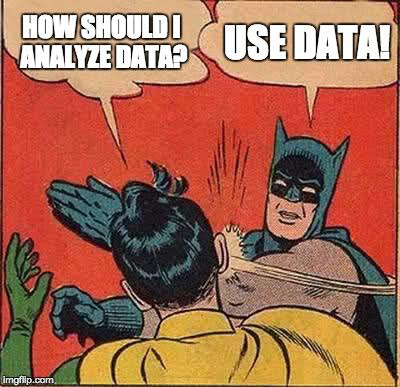
I’m going to be heading out tomorrow for JSM 2016. If you want to catch up I’ll be presenting in the 6-8PM poster session on The Extraordinary Power of Data on Sunday and on data visualization (and other things) in MOOCs at 8:30am on Monday. Here is a little sneak preview, the first slide from my talk:
This year I am so excited that other people have done all the work of going through the program for me and picking out what talks to see. Here is a list of lists.
- Karl Broman - if you like open source software, data viz, and genomics.
- Rstudio - if you like Rstudio
- Mine Cetinkaya Rundel - if you like stat ed, data science, data viz, and data journalism.
- Julian Wolfson - if you like missing sessions and guilt.
- Stephanie Hicks - if you like lots of sessions and can’t make up your mind (also stat genomics, open source software, stat computing, stats for social good…)
If you know about more lists, please feel free to tweet at me or send pull requests.
I also saw the materials for this awesome tutorial on webscraping that I’m sorry I’ll miss.
20 Jul 2016
“Raw data” is one of those terms that everyone in statistics and data science uses but no one defines. For example, we all agree that we should be able to recreate results in scientific papers from the raw data and the code for that paper.
But what do we mean when we say raw data?
When working with collaborators or students I often find myself saying - could you just give me the raw data so I can do the normalization or processing myself. To give a concrete example, I work in the analysis of data from high-throughput genomic sequencing experiments.
These experiments produce data by breaking up genomic molecules into short fragements of DNA - then reading off parts of those fragments to generate “reads” - usually 100 to 200 letters long per read. But the reads are just puzzle pieces that need to be fit back together and then quantified to produce measurements on DNA variation or gene expression abundances.
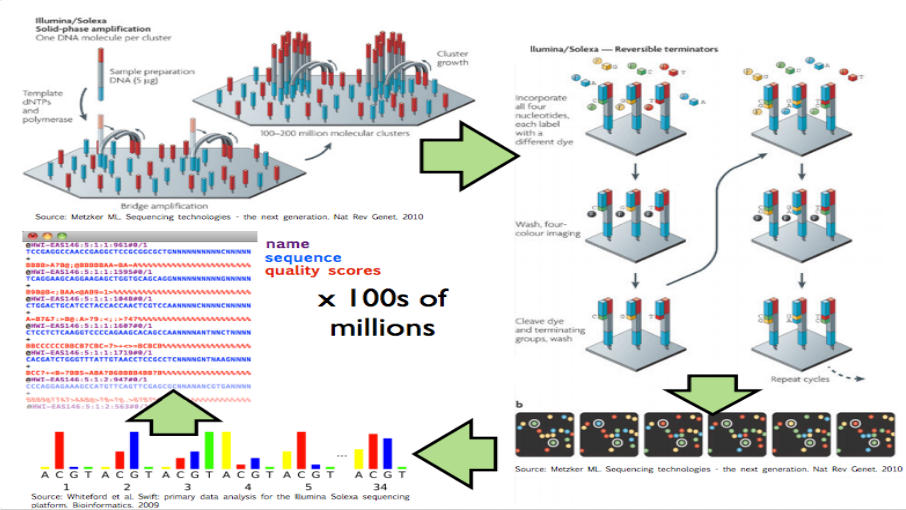
Image from Hector Corrata Bravo’s lecture notes
When I say “raw data” when talking to a collaborator I mean the reads that are reported from the sequencing machine. To me that is the rawest form of the data I will look at. But to generate those reads the sequencing machine first (1) created a set of images for each letter in the sequence of reads, (2) measured the color at the spots on that image to get the quantitative measurement of which letter, and (3) calculated which letter was there with a confidence measure. The raw data I ask for only includes the confidence measure and the sequence of letters itself, but ignores the images and the colors extracted from them (steps 1 and 2).
So to me the “raw data” is the files of reads. But to the people who produce the machine for sequencing the raw data may be the images or the color data. To my collaborator the raw data may be the quantitative measurements I calculate from the reads. When thinking about this I realized an important characteristics of raw data.
Raw data is relative to your reference frame.
In other words the raw data is raw to you if you have done no processing, manipulation, coding, or analysis of the data. In other words, the file you received from the person before you is untouched. But it may not be the rawest version of the data. The person who gave you the raw data may have done some computations. They have a different “raw data set”.
The implication for reproducibility and replicability is that we need a “chain of custody” just like with evidence collected by the police. As long as each person keeps a copy and record of the “raw data” to them you can trace the provencance of the data back to the original source.


 Follow us on twitter


