Simply Statistics A statistics blog by Rafa Irizarry, Roger Peng, and Jeff Leek

On weather forecasts, Nate Silver, and the politicization of statistical illiteracy

As you know, we have a thing for statistical literacy here at Simply Stats. So of course this column over at Politico got our attention (via Chris V. and others). The column is an attack on Nate Silver, who has a blog where he tries to predict the outcome of elections in the U.S., you may have heard of it…

The argument that Dylan Byers makes in the Politico column is that Nate Silver is likely to be embarrassed by the outcome of the election if Romney wins. The reason is that Silver’s predictions have suggested Obama has a 75% chance to win the election recently and that number has never dropped below 60% or so. 

I don’t know much about Dylan Byers, but from reading this column and a quick scan of his twitter feed, it appears he doesn’t know much about statistics. Some people have gotten pretty upset at him on Twitter and elsewhere about this fact, but I’d like to take a different approach: education. So Dylan, here is a really simple example that explains how Nate Silver comes up with a number like the 75% chance of victory for Obama. 

Let’s pretend, just to make the example really simple, that if Obama gets greater than 50% of the vote, he will win the election. Obviously, Silver doesn’t ignore the electoral college and all the other complications, but it makes our example simpler. Then assume that based on averaging a bunch of polls  we estimate that Obama is likely to get about 50.5% of the vote.

Now, we want to know what is the “percent chance” Obama will win, taking into account what we know. So let’s run a bunch of “simulated elections” where on average Obama gets 50.5% of the vote, but there is variability because we don’t have the exact number. Since we have a bunch of polls and we averaged them, we can get an estimate for how variable the 50.5% number is. The usual measure of variance is the standard deviation. Say we get a standard deviation of 1% for our estimate. That would be a pretty accurate number, but not totally unreasonable given the amount of polling data out there. 

We can run 1,000 simulated elections like this in R* (a free software programming language, if you don’t know R, may I suggest Roger’s Computing for Data Analysis class?). Here is the code to do that. The last line of code calculates the percent of times, in our 1,000 simulated elections, that Obama wins. This is the number that Nate would report on his site. When I run the code, I get an Obama win 68% of the time (Obama gets greater than 50% of the vote). But if you run it again that number will vary a little, since we simulated elections. 

The interesting thing is that even though we only estimate that Obama leads by about 0.5%, he wins 68% of the simulated elections. The reason is that we are pretty confident in that number, with our standard deviation being so low (1%). But that doesn’t mean that Obama will win 68% of the vote in any of the elections! In fact, here is a histogram of the percent of the vote that Obama wins: 

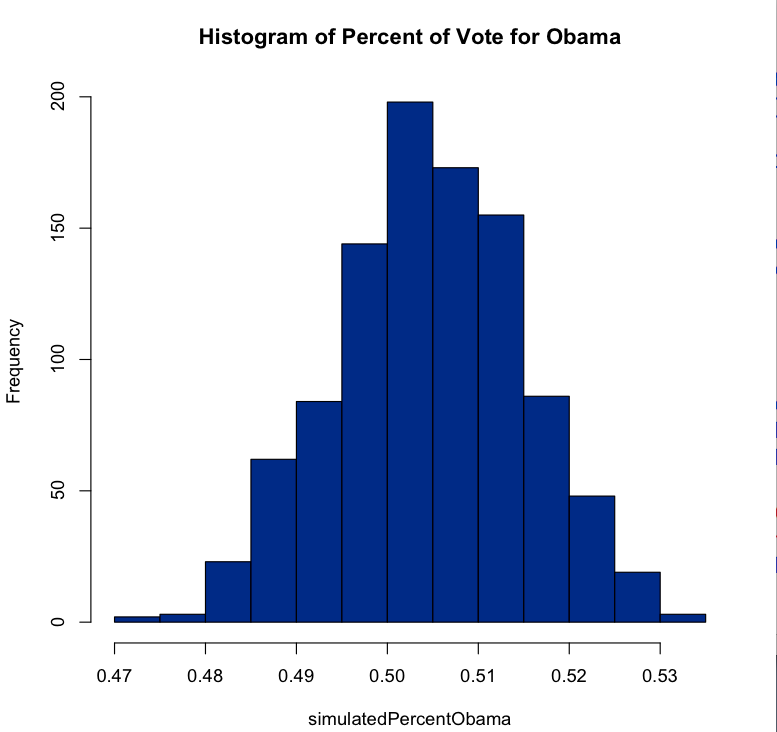
He never gets more than 54% or so and never less than 47% or so. So it is always a reasonably close election. Silver’s calculations are obviously more complicated, but the basic idea of simulating elections is the same. 

Now, this might seem like a goofy way to come up with a “percent chance” with simulated elections and all. But it turns out it is actually a pretty important thing to know and relevant to those of us on the East Coast right now. It turns out weather forecasts (and projected hurricane paths) are based on the same sort of thing - simulated versions of the weather are run and the “percent chance of rain” is the fraction of times it rains in a particular place. 

So Romney may still win and Obama may lose - and Silver may still get a lot of it right. But regardless, the approach taken by Silver is not based on politics, it is based on statistics. Hopefully we can move away from politicizing statistical illiteracy and toward evaluating the models for the real, underlying assumptions they make. 

* In this case, we could calculate the percent of times Obama would win with a formula (called an analytical calculation) since we have simplified so much. In Nate’s case it is much more complicated, so you have to simulate. 

Computing for Data Analysis (Simply Statistics Edition)

As the entire East Coast gets soaked by Hurricane Sandy, I can’t help but think that this is the perfect time to…take a course online! Well, as long as you have electricity, that is. I live in a heavily tree-lined area and so it’s only a matter of time before the lights cut out on me (I’d better type quickly!). 

I just finished teaching my course Computing for Data Analysis through Coursera. This was my first experience teaching a course online and definitely my first experience teaching a course to > 50,000 people. There were definitely some bumps along the road, but the students who participated were fantastic at helping me smooth the way. In particular, the interaction on the discussion forums was very helpful. I couldn’t have done it without the students’ help. So, if you took my course over the past 4 weeks, thanks for participating!

Here are a couple quick stats on the course participation (as of today) for the curious:

  • 50,899: Number of students enrolled
  • 27,900: Number of users watching lecture videos
  • 459,927: Total number of streaming views (over 4 weeks)
  • 414,359: Total number of video downloads (not all courses allow this)
  • 14,375: Number of users submitting the weekly quizzes (graded)
  • 6,420: Number of users submitting the bi-weekly R programming assignments (graded)
  • 6393+3291: Total number of posts+comments to the discussion forum
  • 314,302: Total number of views in the discussion forum

I’ve received a number of emails from people who signed up in the middle of the course or after the course finished. Given that it was a 4-week course, signing up in the middle of the course meant you missed quite a bit of material. I will eventually be closing down the Coursera version of the course—at this point it’s not clear when it will be offered again on that platform but I would like to do so—and so access to the course material will be restricted. However, I’d like to make that material more widely available even if it isn’t in the Coursera format.

So I’m announcing today that next month I’ll be offering the Simply Statistics Edition of Computing for Data Analysis. This will be a slightly simplified version of the course that was offered on Coursera since I don’t have access to all of the cool platform features that they offer. But all of the original content will be available, including some new material that I hope to add over the coming weeks.

If you are interested in taking this course or know of someone who is, please check back here soon for more details on how to sign up and get the course information.

Sunday Data/Statistics Link Roundup (10/28/12)

  1. An important article about anti-science sentiment in the U.S. (via David S.). The politicization of scientific issues such as global warming, evolution, and healthcare (think vaccination) makes the U.S. less competitive. I think the lack of statistical literacy and training in the U.S. is one of the sources of the problem. People use/skew/mangle statistical analyses and experiments to support their view and without a statistically well trained public, it all looks “reasonable and scientific”. But when science seems to contradict itself, it loses credibility. Another reason to teach statistics to everyone in high school.
  2. Scientific American was loaded this last week, here is another article on cancer screening.  The article covers several of the issues that make it hard to convince people that screening isn’t always good. The predictive value of the positive confusion is a huge one in cancer screening right now. The author of the piece is someone worth following on Twitter @hildabast.
  3. A bunch of data on the use of Github. Always cool to see new data sets that are worth playing with for student projects, etc. (via Hilary M.). 
  4. A really interesting post over at Stats Chat about why we study seemingly obvious things. Hint, the reason is that “obvious” things aren’t always true. 
  5. A story on “sentiment analysis” by NPR that suggests that most of the variation in a stock’s price during the day can be explained by the number of Facebook likes. Obviously, this is an interesting correlation. Probably more interesting for hedge funders/stockpickers if the correlation was with the change in stock price the next day. (via Dan S.)
  6. Yihui Xie visited our department this week. We had a great time chatting with him about knitr/animation and all the cool work he is doing. Here are his slides from the talk he gave. Particularly check out his idea for a fast journal. You are seeing the future of publishing.  
  7. Bonus Link: R is a trendy open source technology for big data

I love those first discussions about a new research project

That has got to be the best reason to stay in academia. The meetings where it is just you and a bunch of really smart people thinking about tackling a new project, coming up with cool ideas, and dreaming about how you can really change the way the world works are so much fun.

There is no part of a research job that is better as far as I’m concerned.  It is always downhill after that, you start running into pebbles, your code doesn’t work, or your paper gets rejected. But that first blissful planning meeting always seems so full of potential.

Just had a great one like that and am full of optimism.  

Let's make the Joint Statistical Mettings modular

Have you ever met a statistician that enjoys the joint statistical meetings (JSM)? I haven’t. With the exception of the one night we catch up with old friends there are few positive things we can say about JSM.They are way too big and the two talks I want to see are always somehow scheduled at the same time as mine.

But statisticians actually like conferences. Most of us have a favorite statistics conference, or session within a bigger subject matter conference, that we look forward to going to. But it’s never JSM. So why can’t JSM just be a collection of these conferences? For sure we should drop the current format and come up with something new.

I propose that we start by giving each ASA section two non-concurrent sessions scheduled on two consecutive days (perhaps more slots for bigger sections) and let them do whatever they want. Hopefully they would turn this into the conference that they want to go to. It’s our meeting, we pay for it, so let’s turn it into something we like.