16 Nov 2012
Congratulations to Bradley Saul, the winner of the Simply Statistics Logo contest! We had some great entries which made it difficult to choose between them. You can see the new logo to the right of our home page or the full sized version here:
I made some slight modifications to Bradley’s original code (apologies!). The code for his original version is here:
Here’s the code:
#########################################################
#  Project: Simply Statistics Logo Design
#  Date: 10/17/12
#  Version: 0.00001
#  Author: Bradley Saul
#  Built in R Version: 2.15.0
#########################################################

#Set Graphical parameters
par(mar=c(0, 0, 0, 0), pty='s', cex=3.5, pin=c(6,6))
#Note: I had to hard code the size, so that the text would scale
#on resizing the image. Maybe there is another way to get around font
#scaling issues - I couldn't figure it out.

make_logo <- function(color){

  x1 <- seq(0,1,.001)
  ncps <- seq(0,10,1)
  shapes <- seq(5,15,1)
  # Plot Beta distributions to make purty lines.
  plot(x1, pbeta(x1, shape1=10, shape2=.1, ncp=0), type='l', xlab='', ylab='',
       frame.plot=FALSE, axes=FALSE)
  for(i in 1:length(ncps)){
    lines(x1, pbeta(x1,shape1=.1, shape2=10, ncp=ncps[i]), col=color)
  }

  #Shade in area under curve.
  coord.x <- c(0,x1,1)
  coord.y <- c(0,pbeta(x1,shape1=.1,shape2=10, ncp=10),0)
  polygon(coord.x, coord.y, col=color, border="white")

  #Lazy way to get area between curves shaded, rather than just area under curve.
  coord.y2 <- c(0,pbeta(x1,shape1=10,shape2=.1, ncp=0),0)
  polygon(coord.x, coord.y2, col="white", border="white")

  #Add text
  text(.98,.4,'Simply', col="white", adj=1,family='HersheySerif')
  text(.98,.25,'St*atistics', col="white", adj=1, family="HersheySerif")
}
Thanks to Bradley for the great logo and congratulations!
15 Nov 2012
Last night this article by Chris Drummond of the Canadian National Research Council (Conseil national de recherches Canada) popped up in my Google Scholar alert. The title of the article, “Reproducible Research: a Dissenting Opinion” would seem to indicate that he disagrees with much that has been circulating out there about reproducible research.
Drummond singles out the Declaration published by a Yale Law School Roundtable on Data and Code Sharing (I was not part of the roundtable) as an example of the main arguments in favor of reproducibility and has four main objections. What I found interesting about his piece is that I think I more or less agree with all his objections and yet draw the exact opposite conclusion from him. In his abstract, he concludes that “I would also contend that the effort necessary to meet the [reproducible research] movement’s aims, and the general attitude it engenders, would not serve any of the research disciplines well.”
Let’s take his objections one by one:
-
Reproducibility, at least in the form proposed, is not now, nor has it ever been, an essential part of science. I would say that with the exception of mathematics, this is true. In math, usually you state a theorem and provide the proof. The proof shows you how to obtain the result, so it is a form of reproducibility. But beyond that I would argue that the need for reproducibility is a more recent phenomenon arising from the great complexity and cost of modern data analyses and the lack of funding for full replication. The rise of “consortium science” (think ENCODE project) diminishes our ability to fully replicate (what he calls “Scientific Replication”) an experiment in any reasonable amount of time.
-
The idea of a single well defined scientific method resulting in an incremental, and cumulative, scientific process is highly debatable. He argues that the idea of a forward moving process by which science builds on top of previous results in an orderly and incremental fashion is a fiction. In particular, there is no single “scientific method” into which you can drop in reproducibility as a key component. I think most scientists would agree with this. Science not some orderly process—it’s messy and can seem haphazard and discoveries come at unpredictable times. But that doesn’t mean that people shouldn’t provide the details of what they’ve done so that others don’t have to essentially reverse engineer the process. I don’t see how the disorderly reality of science is an argument against reproducibility.
-
Requiring the submission of data and code will encourage a level of distrust among researchers and promote the acceptance of papers based on narrow technical criteria. I don’t agree with this statement at all. First, I don’t think it will happen. If a journal required code/data, it would be burdensome for some, but it would just be one of the many requirements that journals have. Second, I don’t think good science is about “trust”. Sure, it’s important to be civilized but if you claim a finding, I’m not going to just trust it because we’re both scientists. Finally, he says “Submitting code — in whatever language, for whatever system — will simply result in an accumulation of questionable software. There may be a some cases where people would be able to use it but I would doubt that they would be frequent.” I think this is true, but it’s not necessarily an argument against submitting code. Think of the all the open source/free software packages out there. I would bet that most of that code has only been looked at by one person—the developer. But does that mean open source software as a whole is not valuable?
-
Misconduct has always been part of science with surprisingly little consequence. The public’s distrust is likely more to with the apparent variability of scientific conclusions. I agree with the first part and am not sure about the second. I’ve tried to argue previously that reproducible research is not just about preventing fraud/misconduct. If someone wants to commit fraud, it’s easy to make the fraud reproducible.
In the end, I see reproducibility as not necessarily a new concept, but really an adaptation of an old concept, that is describing materials and methods. The problem is that the standard format for publication—journal articles—has simply not caught up with the growing complexity of data analysis. And so we need to update the standards a bit.
I think the benefit of reproducibility is that if someone wants to question or challenge the findings of a study, they have the materials with which to do so. Providing people with the means to ask questions is how science moves forward.
09 Nov 2012
Tom Louis
Tom Louis is a professor of Biostatistics at Johns Hopkins and will be joining the Census Bureau through an
interagency personnel agreement as the new associate director for research and methodology and chief scientist. Tom has an impressive history of accomplishment in developing statistical methods for everything from environmental science to genomics. We talked to Tom about his new role at the Census, how it relates to his impressive research career, and how young statisticians can get involved in the statistical work at the Census.
SS: How did you end up being invited to lead the research branch of the Census?
TL: Last winter, then-director Robert Groves (now Provost at Georgetown University) asked if I would be interested in the possibility of becoming the next Associate Director of Research and Methodology (R&M) and Chief Scientist, succeeding Rod Little (Professor of Biostatistics at the University of Michigan) in these roles. I expressed interest and after several discussions with Bob and Rod, decided that if offered, I would accept. It was offered and I did accept.
As background, components of my research, especially Bayesian methods, is Census-relevant. Furthermore, during my time as a member of the National Academies Committee on National Statistics I served on the panel that recommended improvements in small area income and poverty estimates, chaired the panel that evaluated methods for allocating federal and state program funds by formula, and chaired a workshop on facilitating innovation in the Federal statistical system.
Rod and I noted that it’s interesting and possibly not coincidental that with my appointment the first two associate directors are both former chairs of Biostatistics departments. It is the case that R&D’s mission is quite similar to that of a Biostatistics department; methods and collaborative research, consultation and education. And, there are many statisticians at the Census Bureau who are not in the R&D directorship, a sociology quite similar to that in a School of Public Health or a Medical campus.
SS: What made you interested in taking on this major new responsibility?
TL: I became energized by the opportunity for national service, and excited by the scientific, administrative, and sociological responsibilities and challenges. I’ll be engaged in hiring and staff development, and increasing the visibility of the bureau’s pre- and post-doctoral programs. The position will provide the impetus to take a deep dive into finite-population statistical approaches, and contribute to the evolving understanding of the strengths and weakness of design-based, model-based and hybrid approaches to inference. That I could remain a Hopkins employee by working via an Interagency Personnel Agreement, sealed the deal. I will start in January 2013 and serve through 2015, and will continue to participate in some Hopkins-based activities.
In addition to activities within the Census Bureau, I’ll be increasing connections among statisticians in other federal statistical agencies, have a role in relations with researchers funded through the NSF to conduct census-related research.
SS: What are the sorts of research projects the Census is involved in? </div>
TL: The Census Bureau designs and conducts the decennial Census, the Current Population Survey, the American Community Survey, many, many other surveys for other Federal Statistical Agencies including the Bureau of Labor Statistics, and a quite extraordinary portfolio of others. Each identifies issues in design and analysis that merit attention, many entail “Big Data” and many require combining information from a variety of sources. I give a few examples, and encourage exploration of www.census.gov/research.
You can get a flavor of the types of research from the titles of the six current centers within R&M: The Center for Adaptive Design, The Center for Administrative Records Research and Acquisition, The Center for Disclosure Avoidance Research, The Center for Economic Studies, The Center for Statistical Research and Methodology and The Center for Survey Measurement. Projects include multi-mode survey approaches, stopping rules for household visits, methods of combining information from surveys and administrative records, provision of focused estimates while preserving identity protection, improved small area estimates of income and of limited english skills (used to trigger provision of election ballots in languages other than English), and continuing investigation of issues related to model-based and design-based inferences.
SS: Are those projects related to your research?</div>
TL: Some are, some will be, some will never be. Small area estimation, hierarchical modeling with a Bayesian formalism, some aspects of adaptive design, some of combining evidence from a variety of sources, and general statistical modeling are in my power zone. I look forward to getting involved in these and contributing to other projects.
SS: How does research performed at the Census help the American Public?</div>
TL: Research innovations enable the bureau to produce more timely and accurate information at lower cost, improve validity (for example, new approaches have at least maintained respondent participation in surveys), enhancing the reputation of the the Census Bureau as a trusted source of information. Estimates developed by Census are used to allocate billions of dollars in school aid, and the provide key planning information for businesses and governments.
SS: How can young statisticians get more involved in government statistical research?</div>
TL: The first step is to become aware of the wide variety of activities and their high impact. Visiting the Census website and those of other federal and state agencies, and the Committee on National Statistics (http://sites.nationalacademies.org/DBASSE/CNSTAT/) and the National Institute of Statistical Sciences (http://www.niss.org/) is a good start. Make contact with researchers at the JSM and other meetings and be on the lookout for pre- and post-doctoral positions at Census and other federal agencies.
08 Nov 2012
The night of the presidential elections I wrote a post celebrating the victory of data over punditry. I was motivated by the personal attacks made against Nate Silver by pundits that do not understand Statistics. The post generated a little bit of (justified) nerdrage (see comment section). So here I clarify a couple of things not as a member of Nate Silver’s fan club (my mancrush started with PECOTA not fivethirtyeight) but as an applied statistician.
The main reason fivethrityeight predicts election results so well is mainly due to the idea of averaging polls. This idea was around way before fivethirtyeight started. In fact, it’s a version of meta-analysis which has been around for hundreds of years and is commonly used to improve results of clinical trials. This election cycle several groups, including Sam Wang (Princeton Election Consortium), Simon Jackman (pollster), and Drew Linzer (VOTAMATIC), predicted the election perfectly using this trick.
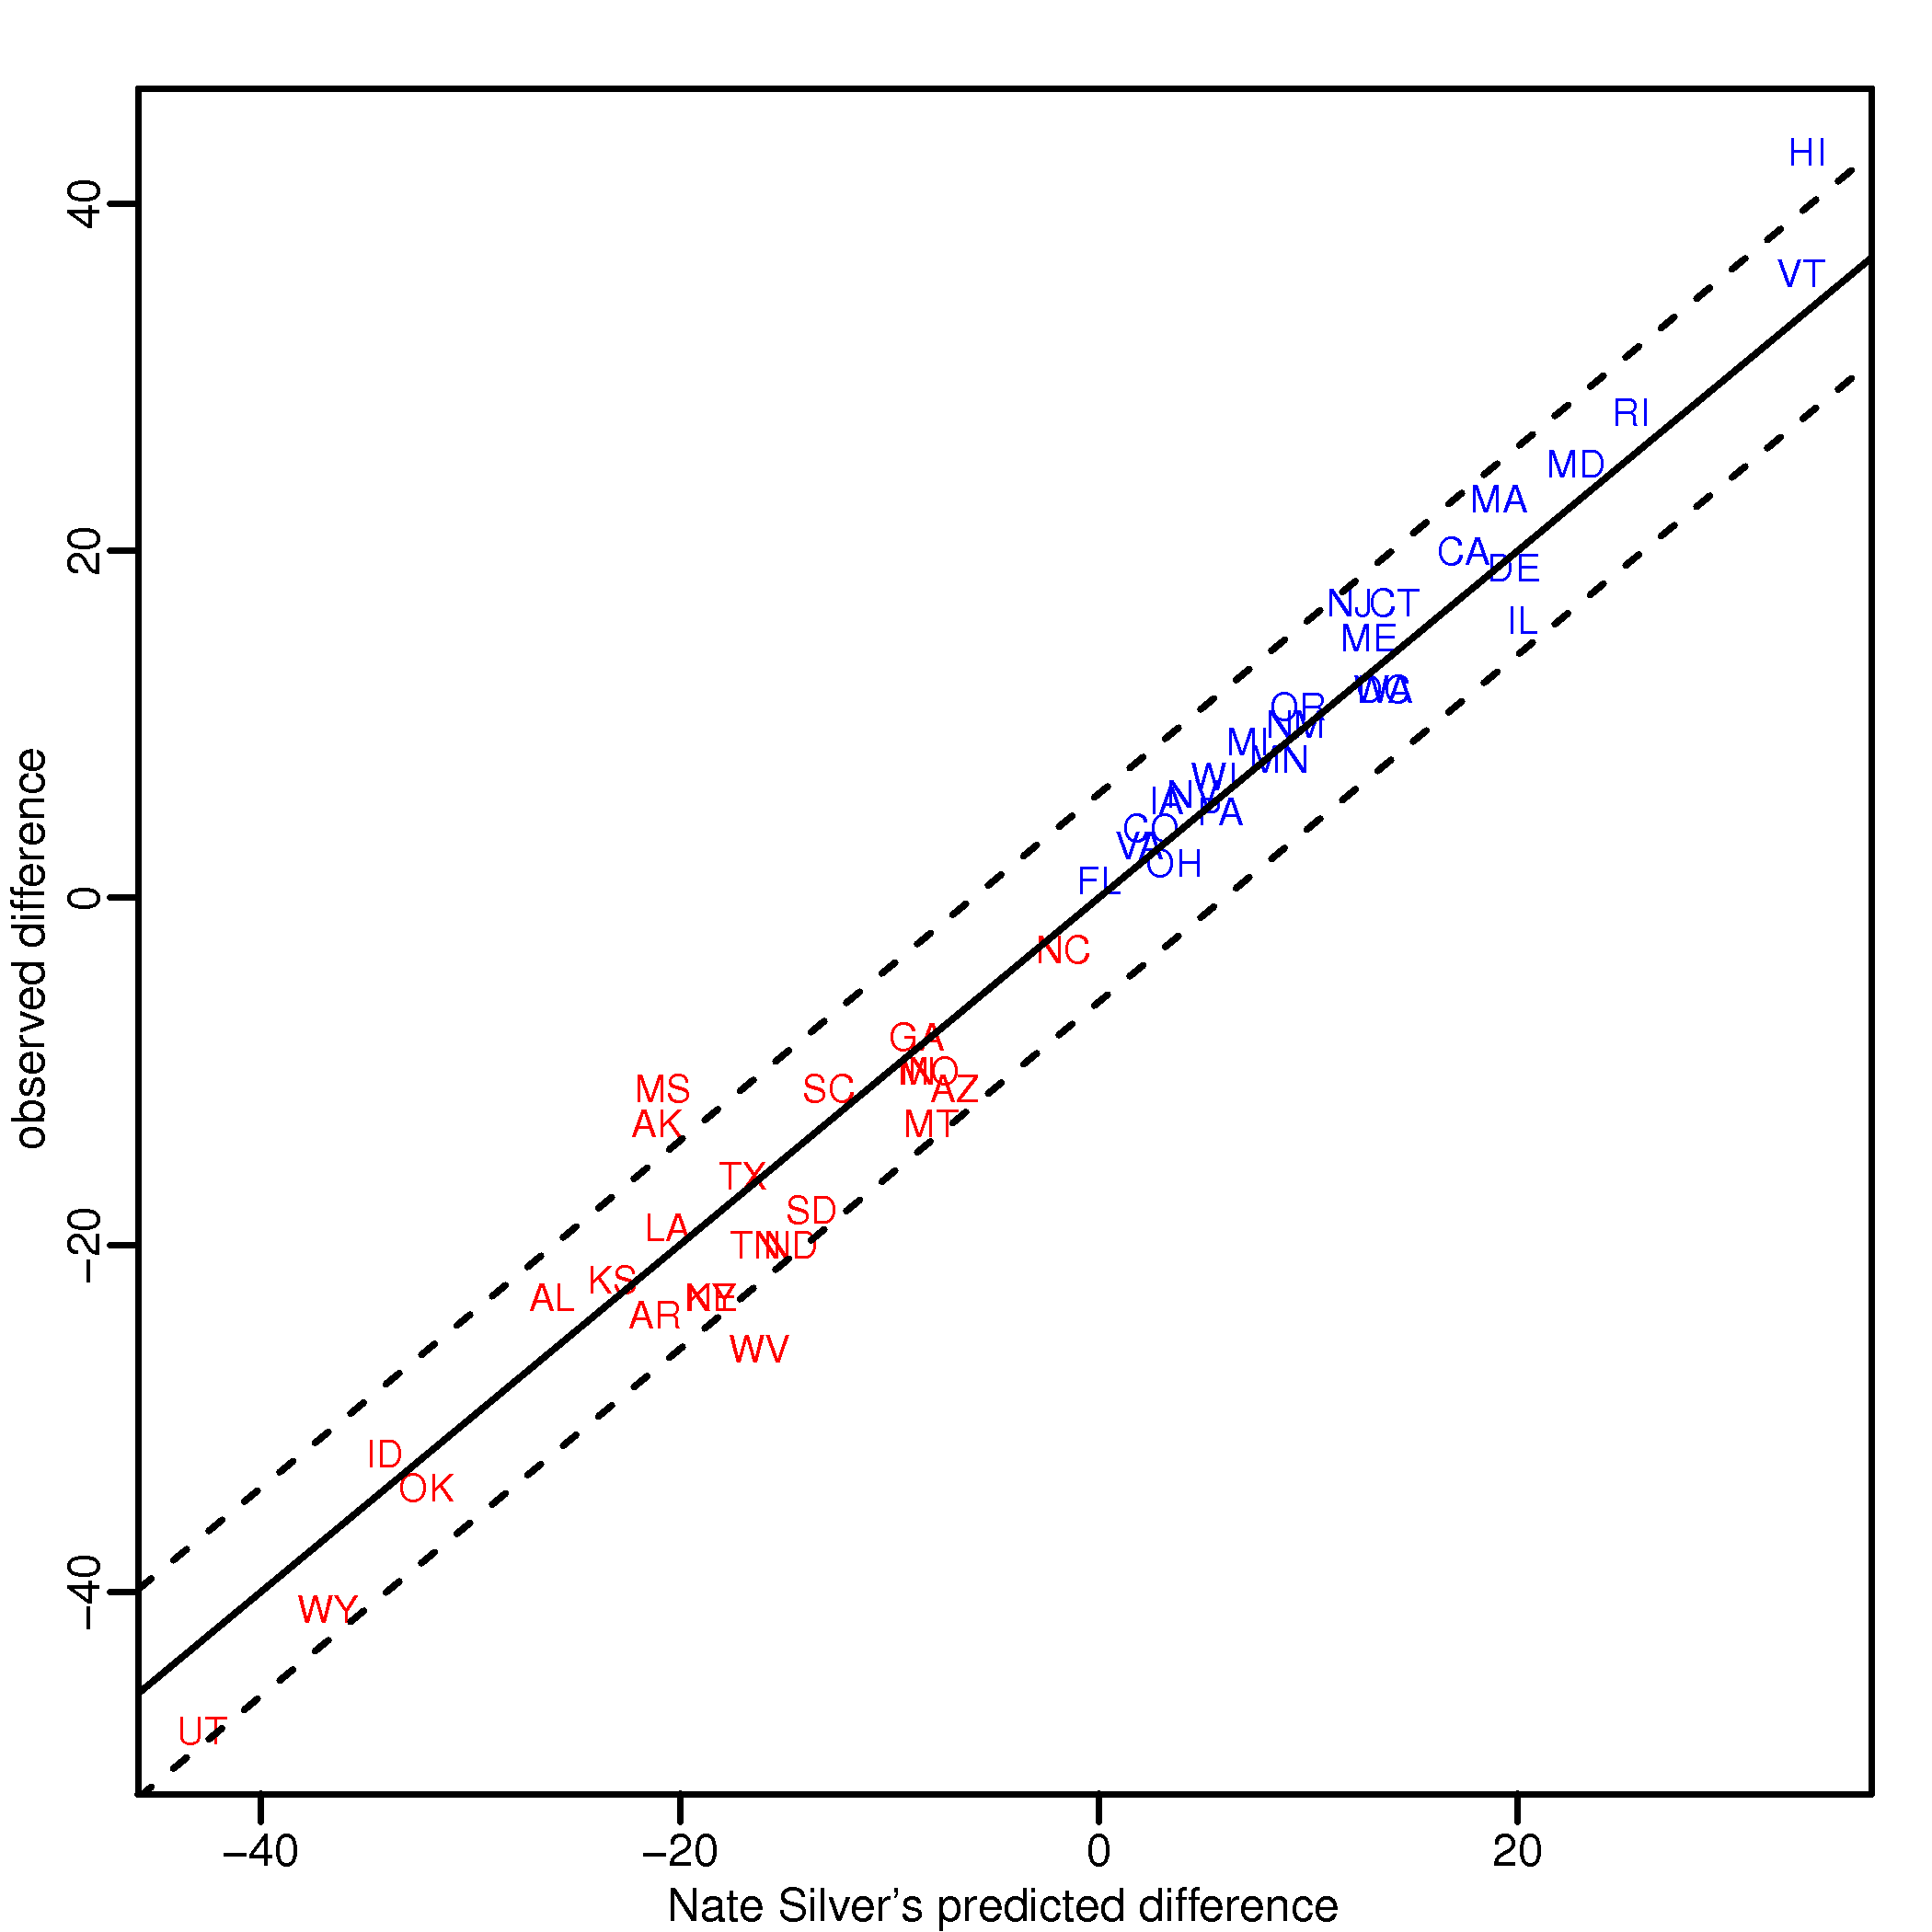
While each group adds their own set of bells and whistles, most of the gains come from the aggregation of polls and understanding the concept of a standard error. Note that while each individual poll may be a bit biased, historical data shows that these biases average out to 0. So by taking the average you obtain a close to unbiased estimate. Because there are so many pollsters, each one conducting several polls, you can also estimate the standard error of your estimate pretty well (empirically rather than theoretically). I include a plot below that provides evidence that bias is not an issue and that standard errors are well estimated. The dash line is at +/- 2 standard erros based on the average (across all states) standard error reported by fivethirtyeight. Note that the variability is smaller for the battleground states where more polls were conducted (this is consistent with state-specific standard error reported by fivethirtyeight).
Finally, there is the issue of the use of the word “probability”. Obviously one can correctly state that there is a 90% chance of observing event A and then have it not happen: Romney could have won and the aggregators still been “right”. Also frequentists complain when we talk about the probability of something that only will happen once? I actually don’t like getting into this philosophical discussion (Gelman has some thoughts worth reading) and I cut people who write for the masses some slack. If the aggregators consistently outperform the pundits in their predictions I have no problem with them using the word “probability” in their reports. I look forward to some of the post-election analysis of all this.

07 Nov 2012
My favorite statistician did it again! Just like in 2008, he predicted the presidential election results almost perfectly. For those that don’t know, Nate Silver is the statistician that runs the fivethirtyeight blog. He combines data from hundreds of polls, uses historical data to weigh them appropriately and then uses a statistical model to run simulations and predict outcomes.
While the pundits were claiming the race was a “dead heat”, the day before the election Nate gave Obama a 90% chance of winning. Several pundits attacked Nate (some attacks were personal) for his predictions and demonstrated their ignorance of Statistics. Jeff wrote a nice post on this. The plot below demonstrates how great Nate’s prediction was. Note that each of the 45 states (including DC) for which he predicted a 90% probability or higher of winning for candidate A, candidate A won. For the other 6 states the range of percentages was 48-52%. If Florida goes for Obama he will have predicted every single state correctly.
Update: Congratulations also to Sam Wang (Princeton Election Consortium) and Simon Jackman (pollster) that also called the election perfectly. And thanks to the pollsters that provided the unbiased (on average) data used by all these folks. Data analysts won “experts” lost.
Update 2: New plot with data from here. Old graph here.
 Follow us on twitter