 Follow us on twitter
 Turning data into numbers
31 Jan 2017 By Jeff LeekEditor’s note: This is the third chapter of a book I’m working on called Demystifying Artificial Intelligence. The goal of the book is to demystify what modern AI is and does for a general audience. So something to smooth the transition between AI fiction and highly mathematical descriptions of deep learning. I’m developing the book over time - so if you buy the book on Leanpub know that there are only three chapters in there so far, but I’ll be adding more over the next few weeks and you get free updates. The cover of the book was inspired by this amazing tweet by Twitter user @notajf. Feedback is welcome and encouraged!
“It is a capital mistake to theorize before one has data.” Arthur Conan Doyle
Data, data everywhere
I already have some data about you. You are reading this book. Does that seem like data? It’s just something you did, that’s not data is it? But if I collect that piece of information about you, it actually tells me a surprising amount. It tells me you have access to an internet connection, since the only place to get the book is online. That in turn tells me something about your socioeconomic status and what part of the world you live in. It also tells me that you like to read, which suggests a certain level of education.
Whether you know it or not, everything you do produces data - from the websites you read to the rate at which your heart beats. Until pretty recently, most of the data you produced wasn’t collected, it floated off unmeasured. Data were painstakingly gathered by scientists one number at a time in small experiments with a few people. This laborious process meant that data were expensive and time-consuming to collect. Yet many of the most amazing scientific discoveries over the last two centuries were squeezed from just a few data points. But over the last two decades, the unit price of data has dramatically dropped. New technologies touching every aspect of our lives from our money, to our health, to our social interactions have made data collection cheap and easy.
To give you an idea of how steep the drop in the price of data has been, in 1967 Stanley Milgram did an experiment to determine the number of degrees of separation between two people in the U.S. (Travers and Milgram 1969). In his experiment he sent 296 letters to people in Omaha, Nebraska and Wichita, Kansas. The goal was to get the letters to a specific person in Boston, Massachusetts. The trick was people had to send the letters to someone they knew, and they then sent it to someone they knew and so on. At the end of the experiment, only 64 letters made it to the individual in Boston. On average, the letters had gone through 6 people to get there.
This is an idea that is so powerful it even became part of the popular consciousness. For example it is the foundation of the internet meme “the 6-degrees of Kevin Bacon” (Wikipedia contributors 2016a) - the idea that if you take any actor and look at the people they have been in movies with, then the people those people have been in movies with, it will take you at most six steps to end up at the actor Kevin Bacon. This idea, despite its popularity was originally studied by Milgram using only 64 data points. A 2007 study updated that number to “7 degrees of Kevin Bacon”. The study was based on 30 billion instant messaging conversations collected over the course of a month or two with the same amount of effort (Leskovec and Horvitz 2008).
Once data started getting cheaper to collect, it got cheaper fast. Take another example, the human genome. The genome is the unique DNA code in every one of your cells. It consists of a set of 3 billion letters that is unique to you. By many measures, the race to be the first group to collect all 3 billion letters from a single person kicked off the data revolution in biology. The project was completed in 2000 after a decade of work and $3 billion to collect the 3 billion letters in the first human genome (Venter et al. 2001). This project was actually a stunning success, most people thought it would be much more expensive. But just over a decade later, new technology means that we can now collect all 3 billion letters from a person’s genome for about $1,000 in about a week (“The Cost of Sequencing a Human Genome,” n.d.), soon it may be less than $100 (Buhr 2017).
You may have heard that this is the era of “big data” from The Economist or The New York Times. It is really the era of cheap data collection and storage. Measurements we never bothered to collect before are now so easy to obtain that there is no reason not to collect them. Advances in computer technology also make it easier to store huge amounts of data digitally. This may not seem like a big deal, but it is much easier to calculate the average of a bunch of numbers stored electronically than it is to calculate that same average by hand on a piece of paper. Couple these advances with the free and open distribution of data over the internet and it is no surprise that we are awash in data. But tons of data on their own are meaningless. It is understanding and interpreting the data where the real advances start to happen.
This explosive growth in data collection is one of the key driving influences behind interest in artificial intelligence. When teaching computers to do something that only humans could do previously, it helps to have lots of examples. You can then use statistical and machine learning models to summarize that set of examples and help a computer make decisions what to do. The more examples you have, the more flexible your computer model can be in making decisions, and the more “intelligent” the resulting application.
What is data?
Tidy data
“What is data”? Seems like a relatively simple question. In some ways this question is easy to answer. According to Wikipedia:
Data (/ˈdeɪtə/ day-tə, /ˈdætə/ da-tə, or /ˈdɑːtə/ dah-tə)[1] is a set of values of qualitative or quantitative variables. An example of qualitative data would be an anthropologist’s handwritten notes about her interviews with people of an Indigenous tribe. Pieces of data are individual pieces of information. While the concept of data is commonly associated with scientific research, data is collected by a huge range of organizations and institutions, ranging from businesses (e.g., sales data, revenue, profits, stock price), governments (e.g., crime rates, unemployment rates, literacy rates) and non-governmental organizations (e.g., censuses of the number of homeless people by non-profit organizations).
When you think about data, you probably think of orderly sets of numbers arranged in something like an Excel spreadsheet. In the world of data science and machine learning this type of data has a name - “tidy data” (Wickham and others 2014). Tidy data has the properties that all measured quantities are represented by numbers or character strings (think words). The data are organized such that.
- Each variable you measured is in one column
- Each different measurement of that variable is in a different row
- There is one data table for each “type” of variable.
- If there are multiple tables then they are linked by a common ID.
This idea is borrowed from data management schemas that have long been used for storing data in databases. Here is an example of a tidy data set of swimming world records.
| year | time | sex |
|---|---|---|
| 1905 | 65.8 | M |
| 1908 | 65.6 | M |
| 1910 | 62.8 | M |
| 1912 | 61.6 | M |
| 1918 | 61.4 | M |
| 1920 | 60.4 | M |
| 1922 | 58.6 | M |
| 1924 | 57.4 | M |
| 1934 | 56.8 | M |
| 1935 | 56.6 | M |
This type of data, neat, organized and nicely numeric is not the kind of data people are talking about when they say the “era of big data”. Data almost never start their lives in such a neat and organized format.
Raw data
The explosion of interest in AI has been powered by a variety of types of data that you might not even think of when you think of “data”. The data might be pictures you take and upload to social media, the text of the posts on that same platform, or the sound captured from your voice when you speak to your phone.
Social media and cell phones aren’t the only area where data is being collected more frequently. Speed cameras on roads collect data on the movement of cars, electronic medical records store information about people’s health, wearable devices like Fitbit collect information on the activity of people. GPS information stores the location of people, cars, boats, airplanes, and an increasingly wide array of other objects.
Images, voice recordings, text files, and GPS coordinates are what experts call “raw data”. To create an artificial intelligence application you need to begin with a lot of raw data. But as we discussed in the simple AI example from the previous chapter - a computer doesn’t understand raw data in its natural form. It is not always immediately obvious how the raw data can be turned into numbers that a computer can understand. For example, when an artificial intelligence works with a picture the computer doesn’t “see” the picture file itself. It sees a set of numbers that represent that picture and operates on those numbers. The first step in almost every artificial intelligence application is to “pre-process” the data - to take the image files or the movie files or the text of a document and turn it into numbers that a computer can understand. Then those numbers can be fed into algorithms that can make predictions and ultimately be used to make an interface look intelligent.
Turning raw data into numbers
So how do we convert raw data into a form we can work with? It depends on what type of measurement or data you have collected. Here I will use two examples to explain how you can convert images and the text of a document into numbers that an algorithm can be applied to.
Images
Suppose that we were developing an AI to identify pictures of the author of this book. We would need to collect a picture of the author - maybe an embarrassing one.

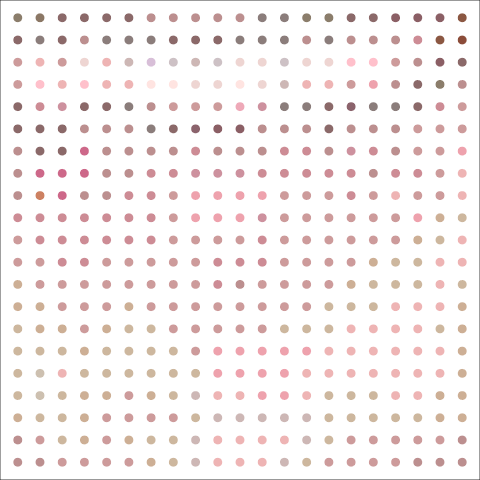
This picture is made of pixels. You can see that if you zoom in very close on the image and look more closely. You can see that the image consists of many hundreds of little squares, each square just one color. Those squares are called pixels and they are one step closer to turning the image into numbers.

You can think of each pixel like a dot of color. Let’s zoom in a little bit more and instead of showing each pixel as a square show each one as a colored dot.
Imagine we are going to build an AI application on the basis of lots of images. Then we would like to turn a set of images into “tidy data”. As described above a tidy data set is defined as the following.
- Each variable you measured is in one column
- Each different measurement of that variable is in a different row
- There is one data table for each “type” of variable.
- If there are multiple tables then they are linked by a common ID.
A translation of tidy data for a collection of images would be the following.
- Variables: Are the pixels measured in the images. So the top left pixel is a variable, the bottom left pixel is a variable, and so on. So each pixel should be in a separate column.
- Measurements: The measurements are the values for each pixel in each image. So each row corresponds to the values of the pixels for each row.
- Tables: There would be two tables - one with the data from the pixels and one with the labels of each image (if we know them).
To start to turn the image into a row of the data set we need to stretch the dots into a single row. One way to do this is to snake along the image going from top left corner to bottom right corner and creating a single line of dots.
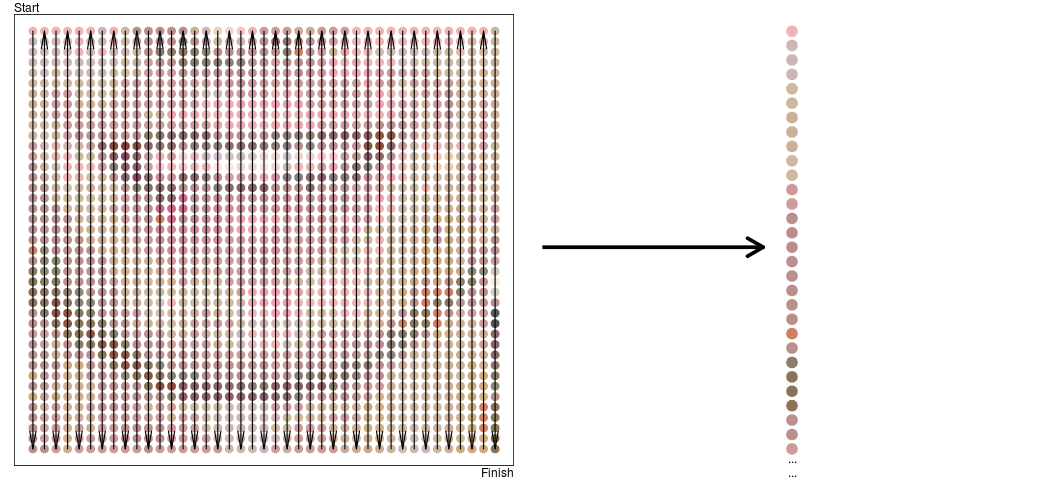
This still isn’t quite data a computer can understand - a computer doesn’t know about dots. But we could take each dot and label it with a color name.
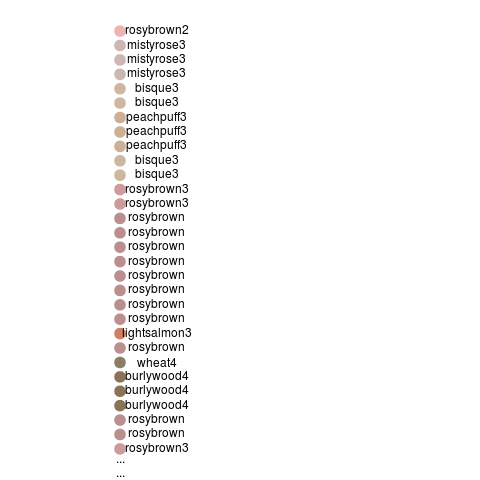
We could take each color name and give it a number, something like rosybrown = 1, mistyrose = 2, and so on. This approach runs into some trouble because we don’t have names for every possible color and because it is pretty inefficient to have a different number for every hue we could imagine.
But that would be both inefficient and not very understandable by a computer. An alternative strategy that is often used is to encode the intensity of the red, green, and blue colors for each pixel. This is sometimes called the rgb color model (Wikipedia contributors 2016b). So for example we can take these dots and show how much red, green, and blue they have in them.
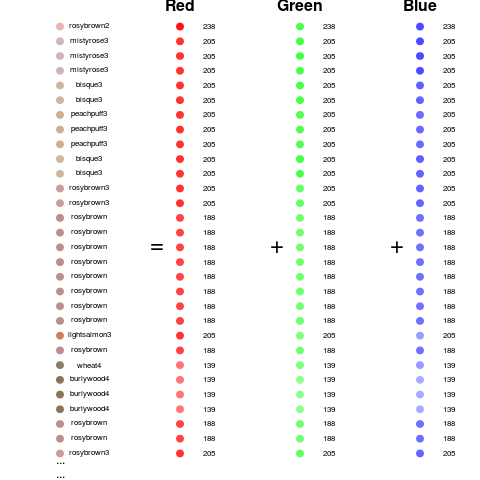
Looking at it this way we now have three measurements for each pixel. So we need to update our tidy data definition to be:
- Variables: Are the three colors for each pixel measured in the images. So the top left pixel red value is a variable, the top left pixel green value is a variable and so on. So each pixel/color combination should be in a separate column.
- Measurements: The measurements are the values for each pixel in each image. So each row corresponds to the values of the pixels for each row.
- Tables: There would be two tables - one with the data from the pixels and one with the labels of each image (if we know them).
So a tidy data set might look something like this for just the image of Jeff.
| id | label | p1red | p1green | p1blue | p2red | … |
|---|---|---|---|---|---|---|
| 1 | “jeff” | 238 | 180 | 180 | 205 | … |
Each additional image would then be another row in the data set. As we will see in the chapters that follow we can then feed this data into an algorithm for performing an artificial intelligence task.
Notes
Parts of this chapter from appeared in the Simply Statistics blog post “The vast majority of statistical analysis is not performed by statisticians” written by the author of this book.
References
Buhr, Sarah. 2017. “Illumina Wants to Sequence Your Whole Genome for $100.” https://techcrunch.com/2017/01/10/illumina-wants-to-sequence-your-whole-genome-for-100/.
Leskovec, Jure, and Eric Horvitz. 2008. “Planetary-Scale Views on an Instant-Messaging Network,” 6~mar.
“The Cost of Sequencing a Human Genome.” n.d. https://www.genome.gov/sequencingcosts/.
Travers, Jeffrey, and Stanley Milgram. 1969. “An Experimental Study of the Small World Problem.” Sociometry 32 (4). [American Sociological Association, Sage Publications, Inc.]: 425–43.
Venter, J Craig, Mark D Adams, Eugene W Myers, Peter W Li, Richard J Mural, Granger G Sutton, Hamilton O Smith, et al. 2001. “The Sequence of the Human Genome.” Science 291 (5507). American Association for the Advancement of Science: 1304–51.
Wickham, Hadley, and others. 2014. “Tidy Data.” Under Review.
Wikipedia contributors. 2016a. “Six Degrees of Kevin Bacon.” https://en.wikipedia.org/w/index.php?title=Six_Degrees_of_Kevin_Bacon&oldid=748831516.
———. 2016b. “RGB Color Model.” https://en.wikipedia.org/w/index.php?title=RGB_color_model&oldid=756764504.