Follow us on twitter
 Smoking is a choice, breathing is not.
14 Dec 2011Over the last week or so I’ve been posting about the air pollution levels in Beijing, China. The twitter feed from the US Embassy there makes it easy to track the hourly levels of fine particulate matter (PM2.5) and you can use this R code to make a graph of the data.
One problem with talking about particulate matter levels is that the units are a bit abstract. We usually talk in terms of micrograms per cubic meter (mcg/m^3), which is a certain mass of particles per volume of air. The 24-hour national ambient air quality standard for fine PM in the US is 35 mcg/m^3. But what does that mean in reality?
C. Arden Pope III and colleagues recently wrote an interesting paper in Environmental Health Perspectives on the dose-response relationship between particles and lung cancer and cardiovascular disease. They combined data from air pollution studies and smoking studies to estimate the dose-response curve for a very large range of PM levels. Ambient air pollution, not surprisingly, is on the low-end of PM exposure, followed by second hand smoke, followed by active smoking. One challenge they faced is putting everything on the same scale in terms of PM exposure so that the different studies could be compared.
Here are the important details: On average, actively smoking a cigarette generates a dose of about 12 milligrams (mg) of particulate matter. Daily inhalation rates obviously depend on your size, age, physical activity, health, and other factors, but in adults they range from about 13 to 23 cubic meters of air per day. For convenience, I’ll just take the midpoint of that range, which is 18 cubic meters per day.
If your city’s fine PM levels were compliant with the US national standard of 35 mcg/m^3, then in the worst case scenario you’d be breathing in about 630 micrograms of particles per day, which is about 0.05 cigarettes (1 cigarette every 20 days). Sounds like it’s not too bad, but keep in mind that most of the increase in risk from smoking is seen in the low range of the dose-response curve (although this is obviously very low).
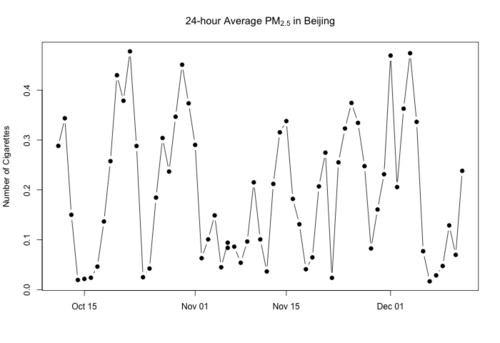
If we move now to Beijing, where 24-hour average levels can easily reach up to 300 mcg/m^3 (and indoor levels can reach 200 mcg/m^3), then we’re talking about a daily dose of almost half a cigarette. Now, half a cigarette might still seem like not that much, but keep in mind that pretty much everyone is exposed: old and young, sick and healthy_._ Not everyone gets the same dose because of variation in inhalation rates, but even the low end of the range gives you about 0.3 cigarettes.
Beijing is hardly alone here, as a number of studies in Asian cities show comparable levels of fine PM. I’ve redone my previous plot of PM2.5 in Beijing in terms of number cigarettes per day. Here’s the last 2 months in Beijing (for an average adult).